


For most utilities with wildfire exposure, the era of relying on the USFS' Wildfire Hazard Potential (WHP) maps is essentially over, not because WHP maps stopped being useful, but because they stopped being enough.
Boards have seen them. Regulators expect them. Wildfire mitigation plans are built around them, layered with vegetation data, asset inventories, fire history, and community risk indicators. That progress is real. A shared risk map gives an organization a common starting point for a conversation that used to happen in silos.
But for the people who actually have to act on that map — engineers, operations managers, vegetation crews, finance teams — the map is rarely where the hard part starts. It's where it ends.
The Knowing-Doing Gap
Ask a wildfire program manager which feeder should be addressed first, which corridor deserves this quarter's vegetation budget, or which mitigation project will produce the largest measurable reduction in risk, and you will hear the challenges. There is data, but this is difficult to use, stand alone, in decision making. Jeffrey Pfeffer, in the business classic, The Knowing-Doing Gap described how most firms have a labyrinth of organizational roadblocks. A WHP-based solution can't answer the question a regulator, board member, cooperative member, or bond investor is likely to ask afterward: how do you know the investment worked?
This isn't a data problem. Most utilities have more wildfire-relevant data than any single team can reasonably absorb — GIS layers, vegetation records, inspection histories, outage data, weather feeds, fire behavior models, community vulnerability indices, and a growing stack of regulatory reporting requirements.
The harder problem is turning that data into a decision framework that holds up under scrutiny — from a field crew, a CFO, and a regulator, all at once.
A Layered View of Risk
One way through this is to stop treating wildfire risk as a single score and start treating it as a sequence of questions, each requiring a different resolution. A system of data engineering, which consolidates the information and provides a Natural Language solution resolves these difficulties.
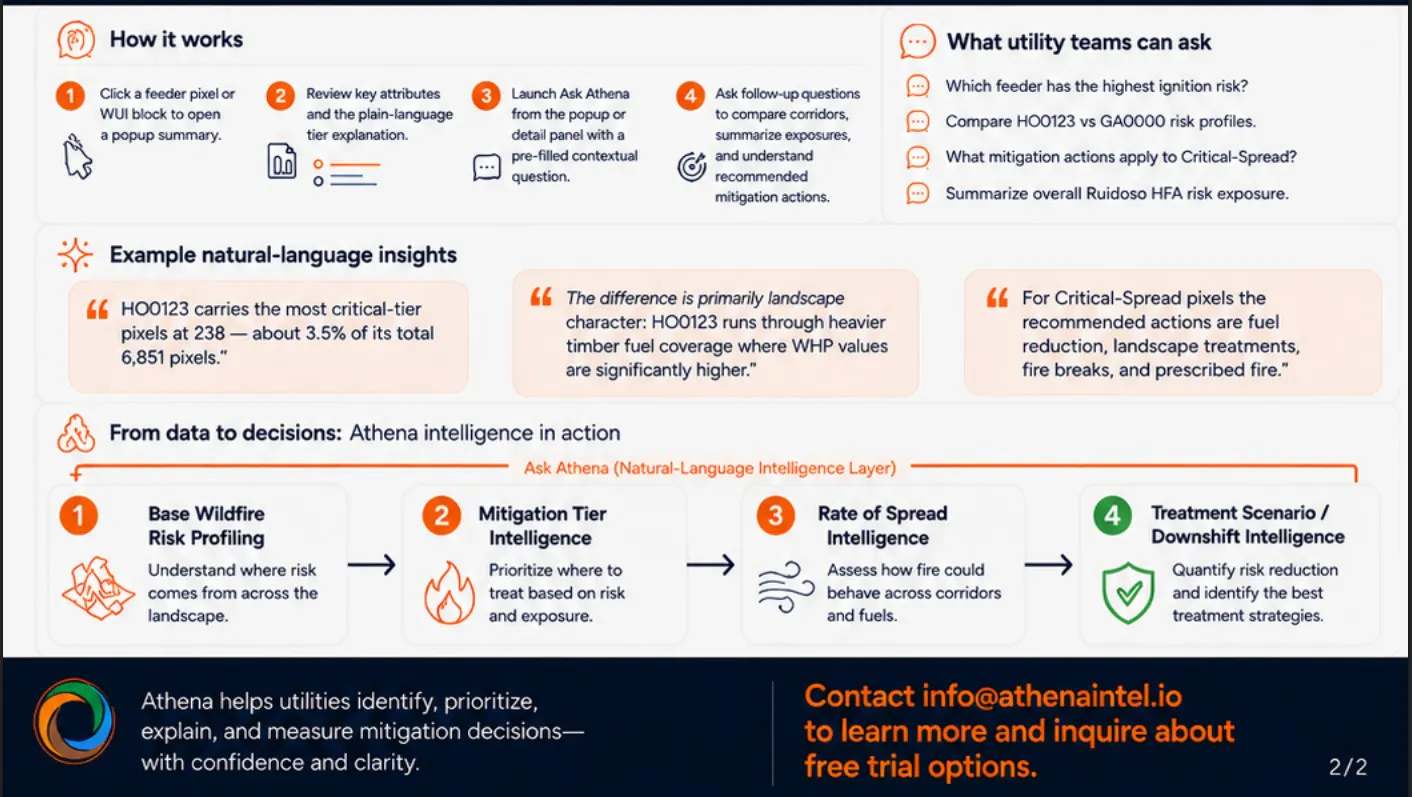
Planning-level risk answers where exposure exists across a service territory — useful for long-range system hardening, vegetation strategy, and monitoring priorities. This is often where smaller municipal utilities and cooperatives get the most leverage, since it supports serious long-range planning without a large in-house analytics team.
Tactical-level risk narrows the question from "is this area exposed?" to "which specific corridors, spans, or acres are actually driving the exposure?" This is the resolution vegetation teams, line crews, and engineering managers need to justify a specific treatment plan rather than a general one.
Fire behavior adds a dynamic layer on top of static risk — how fire is likely to move across terrain under given conditions. This matters for access and egress planning, PSPS thresholds, suppression coordination, and emergency staging.
Before-and-after impact is the layer that matters most once budget season and rate cases arrive. If a utility hardens a line segment, clears a corridor, or improves access around a critical asset, it needs a defensible way to show what changed — not just that work was done, but that risk measurably declined as a result.
None of this replaces engineering judgment or field experience. It gives those teams a more consistent structure for organizing decisions and explaining them later.
From Maps to Operational Questions
Historically, translating a risk map into something an engineer, a finance analyst, and a regulator can each use has depended heavily on GIS specialists working case by case. That translation step is often where wildfire programs slow down.
A more usable framework lets people ask direct, operational questions instead of requesting a custom map every time: Which feeder has the highest wildfire exposure? Which corridors should be compared before allocating this year's vegetation budget? Which locations matter most for access and egress planning? Which completed mitigation project actually changed the risk profile, and by how much?
The goal isn't to replace the underlying models — it's to make them usable in the ordinary course of planning, budgeting, field work, and reporting, without a specialist as the bottleneck.
Explainability matters here as much as accuracy: a risk score without a clear account of what's driving it is difficult for an engineer to trust or a regulator to accept.
Why This Matters Now
Wildfire mitigation spending is under more scrutiny than it's ever been. The need has grown, but it is not enough to invest. Coops, municipal power companies and public utilities increasingly have to explain why a specific project was selected, why it was prioritized ahead of other work, and how its effectiveness will be measured over time.
That scrutiny is coming from every direction at once, and each audience speaks a different language. A field crew thinks in terms of access, vegetation, slope, and line condition. A CFO thinks in terms of capital allocation, avoided loss, rate recovery, and credit impact. A regulator wants evidence that a wildfire mitigation plan is reasonable, consistent, and grounded in data rather than assumption. Insurers, lenders, cooperative members, and municipal bond investors are asking versions of the same question from the outside.
A layered approach helps connect those perspectives without forcing everyone onto the same dashboard. Broad risk profiling supports planning conversations. Granular analysis supports treatment targeting. Fire behavior modeling supports response planning. Before-and-after analysis supports the business case a utility has to make to nearly everyone eventually.
A handful of platforms are starting to build toward this layered structure directly, rather than leaving utilities to stitch it together internally — Athena Intelligence's Voice of the Acre is one example, pairing probabilistic wildfire modeling with parcel-level resolution and mitigation-sensitivity — but the underlying shift in expectations is bigger than any single vendor. It's a shift in what "having a wildfire program" is expected to mean.
The Core Problem
The central challenge for utilities is no longer identifying wildfire risk. Most organizations with meaningful exposure already have. The challenge is moving from awareness to action in a way that's practical, defensible, and repeatable — where a field engineer, a finance team, and a regulator can look at the same underlying data and each get an answer to their own question.
As wildfire programs mature, the utilities in the best position won't necessarily be the ones with the most data. They'll be the ones that can turn complex environmental, asset, and operational information into decisions that engineers can act on, managers can defend, and regulators can understand.
Athena Speaks on wildfire risk, resilience, and infrastructure finance. Athena Intelligence’s Voice of the Acre® provides operational geospatial intelligence for decision optimization used by utilities, insurers, and municipalities to deploy hundreds of millions in capital more effectively. If you would like a free demonstration, based on part of your utility's area, please contact us at [email protected]