COAL CURRENTS: Weekly Intelligence Brief for Metallurgical and Thermal Coal
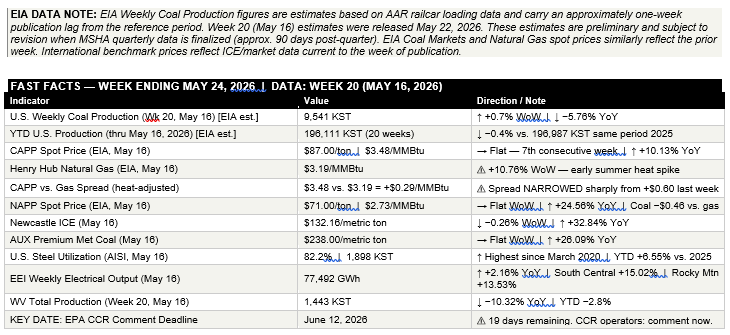
FAST FACTS
EXECUTIVE SUMMARY
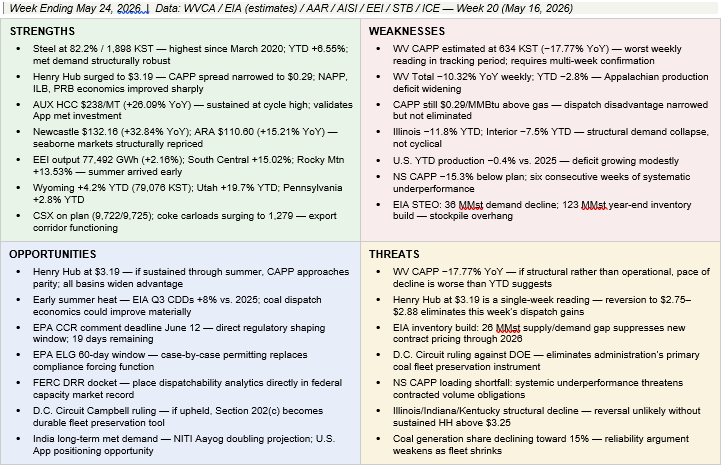
CHARLESTON, W.Va. — The week ending May 24 delivers a data set more energized than the prior six weeks of spring shoulder-season flatness — for a reason that reshapes the price analysis across every coal basin: an early summer heat event arrived in the South Central and Rocky Mountain regions with enough force to push Henry Hub natural gas spot prices from $2.88 to $3.19/MMBtu in a single week (+10.76%), while simultaneously driving total U.S. electrical output to 77,492 GWh — the highest weekly figure in the six-week tracking period. South Central output posted a +15.02% YoY gain; Rocky Mountain gained 13.53%. Summer arrived early in the south-central grid, and it is burning gas at a rate that matters for every coal dispatch decision in basins competitive with gas at current prices.
That gas price move reshapes the CAPP dispatch arithmetic materially. Seven consecutive weeks at $87.00/ton ($3.48/MMBtu) put CAPP coal at $0.60 above Henry Hub as recently as last week. This week, with Henry Hub at $3.19, that premium narrows to $0.29/MMBtu — a 52% reduction in the gas advantage in a single data point. NAPP at $2.73/MMBtu is now $0.46 below gas, an advantage that doubled in one week. ILB at $2.40 holds a $0.79 advantage. PRB’s dominance is absolute at $0.86/MMBtu. If Henry Hub holds above $3.00 through a warm summer — consistent with EIA’s Q3 CDD forecast of +8% vs. last year — the CAPP dispatch calculus shifts from structurally disadvantaged to competitive at the margin.
Production at 9,541 KST for Week 20 is the EIA estimate released May 22 — the third consecutive week of recovery from the Week 16 low of 9,401 KST. But the YoY comparison turned sharply negative at −5.76%, against a strong corresponding week in 2025. YTD through twenty weeks, estimated U.S. production stands at 196,111 KST, −0.4% behind 2025’s 196,987 KST through the same point. The deficit has grown modestly from last week’s −0.2%.
West Virginia delivered the week’s most jarring single data point: WV CAPP at 634 KST, down 17.77% from the corresponding 2025 week. WV NAPP at 809 KST held closer to prior-year levels (−3.46%). Combined WV total of 1,443 KST was down 10.32% YoY — the steepest weekly YoY decline in the state’s six-week tracking period. A single-week decline of this magnitude in CAPP underground production can reflect operational factors — equipment cycling, mine sequencing, shift scheduling — as readily as structural market withdrawal. The YTD WV CAPP figure of −4.2% is the more durable signal. Monitor the next two weeks.
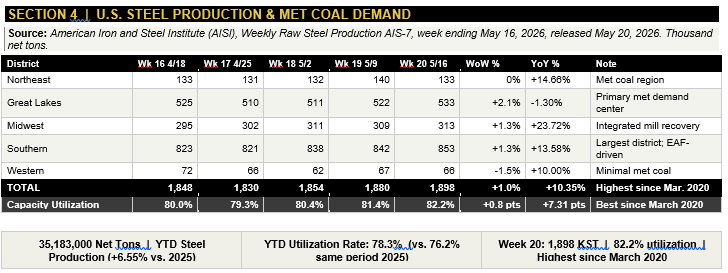
Steel production at 1,898 KST and 82.2% utilization holds at its highest since March 2020 for the second consecutive week. Great Lakes district at 533 KST is the demand center for Northern Appalachian coking coal. Australian premium hard coking coal at $238/MT confirms the global market is pricing met coal demand at levels that validate Appalachian underground mine investment.
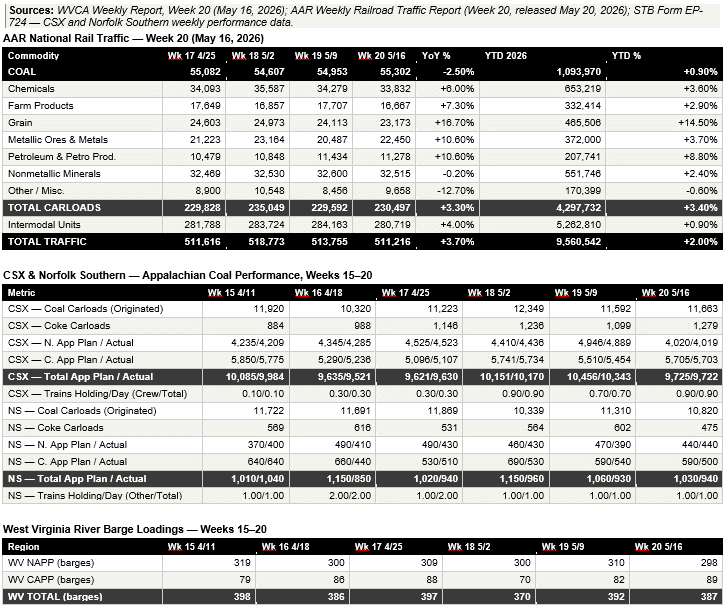
On transportation: CSX ran essentially on plan in Week 20 — 9,722 actual versus 9,725 planned, near-perfect execution. Norfolk Southern’s Central Appalachian shortfall persisted: 500 actual versus 590 planned (−15.3%). NS NAPP finally reached plan at 440/440. The NS total of 940 versus 1,030 planned (−8.7%) is a modest improvement from recent weeks but remains a systematic underperformance that NS-served shippers should be documenting for the STB record.
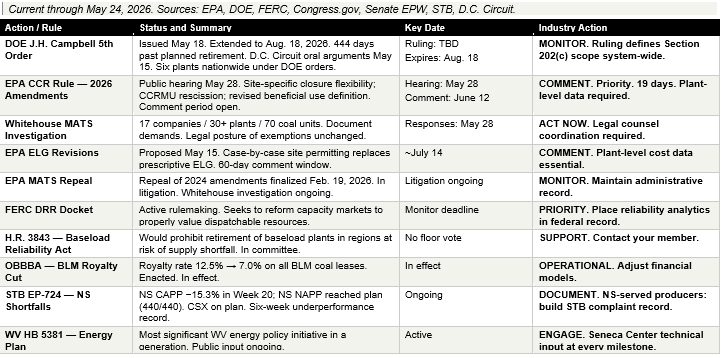
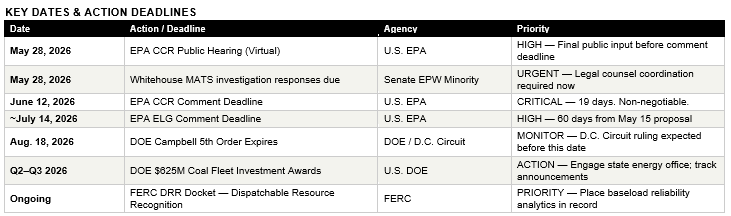
Two regulatory deadlines arrive within days of each other: EPA CCR public hearing May 28 and Senate Whitehouse MATS investigation responses also due May 28. The EPA CCR comment deadline closes June 12 — nineteen days from this report. The DOE’s fifth emergency order keeping J.H. Campbell running through August 18 was issued this past week. The D.C. Circuit has the case. Watch the litigation; its outcome defines whether Section 202(c) becomes a durable coal fleet preservation instrument or a one-time emergency tool.
SECTION 1 | U.S. COAL PRODUCTION
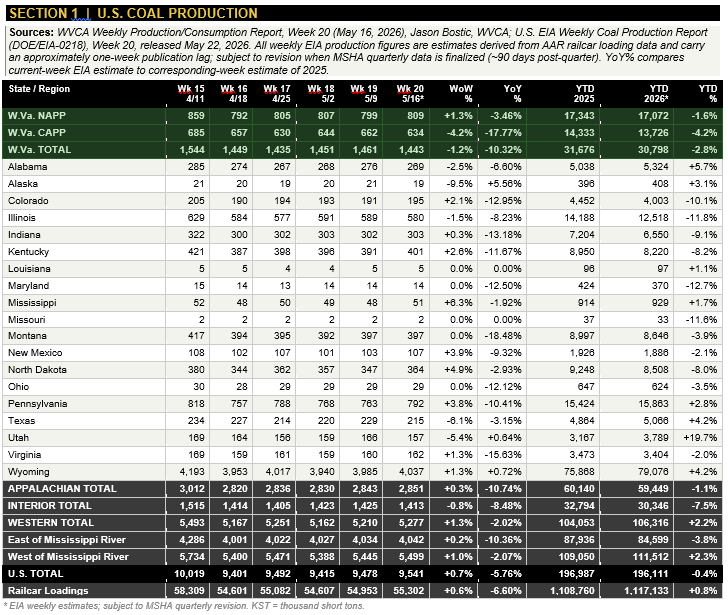
Sources: WVCA Weekly Production/Consumption Report, Week 20 (May 16, 2026), Jason Bostic, WVCA; U.S. EIA Weekly Coal Production Report (DOE/EIA-0218), Week 20, released May 22, 2026. All weekly EIA production figures are estimates derived from AAR railcar loading data and carry an approximately one-week publication lag; subject to revision when MSHA quarterly data is finalized (~90 days post-quarter). YoY% compares current-week EIA estimate to corresponding-week estimate of 2025.
SECTION 1 | US COAL PRODUCTION
PRODUCTION ANALYSIS: The EIA-estimated Week 20 total of 9,541 KST marks the third consecutive week of recovery from the Week 16 low of 9,401 KST. The WoW gain of 63 KST (+0.7%) reflects the increase in AAR coal carloads from 54,953 to 55,302. The YoY comparison at −5.76% is the weakest in the six-week tracking period, reflecting a strong corresponding week in 2025. YTD estimated production of 196,111 KST is −0.4% behind 2025’s 196,987 KST — a deficit that widened modestly from last week’s −0.2%.
West Virginia: WV CAPP’s estimated collapse to 634 KST (−17.77% YoY, −4.2% WoW) is the week’s starkest number. Single-week swings of this magnitude in underground Appalachian operations frequently reflect equipment downtime, mine rotation, or shift scheduling rather than permanent capacity withdrawal. The YTD WV CAPP figure of −4.2% is the more durable structural indicator. WV NAPP at 809 KST (−3.46% YoY) is more consistent. The combined WV estimated YTD shortfall of 878 KST versus 2025 represents reduced severance tax revenue that state and county budget officers are already tracking as a gap. Watch the next two weeks.
Regional Picture: Utah at +19.7% YTD and Wyoming at +4.2% YTD remain the production backstops; Pennsylvania’s +2.8% YTD confirms export-driven met coal demand is translating into mine-level decisions. Illinois at −11.8% YTD has shed 1,670 KST versus 2025 through twenty weeks — a structural loss to gas-to-coal dispatch in reverse across Midwest power plants. Interior at −7.5% YTD is not a weather pattern; it is market share lost to gas that the current price arithmetic does not reverse without sustained gas price increases.
SECTION 2 | COAL & NATURAL GAS PRICES
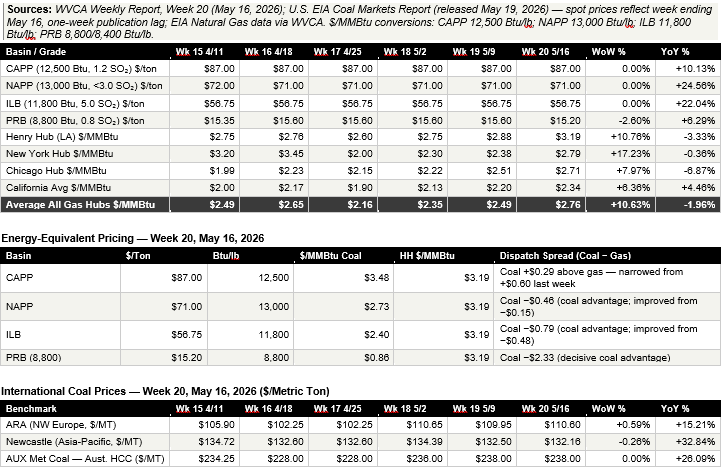
Sources: WVCA Weekly Report, Week 20 (May 16, 2026); U.S. EIA Coal Markets Report (released May 19, 2026) — spot prices reflect week ending May 16, one-week publication lag; EIA Natural Gas data via WVCA. $/MMBtu conversions: CAPP 12,500 Btu/lb; NAPP 13,000 Btu/lb; ILB 11,800 Btu/lb; PRB 8,800/8,400 Btu/lb.
PRICE COMMENTARY: The price story this week pivots on one number: Henry Hub at $3.19/MMBtu. This is the highest gas price in the six-week tracking period and the first week gas moved decisively higher rather than bouncing in a $2.60–$2.88 range. The cause is early summer heat in the South Central and Rocky Mountain grids. CAPP at $3.48/MMBtu is now only $0.29 above gas — down from $0.60 last week, a 52% narrowing in a single data point. NAPP at $2.73 is now $0.46 below gas; ILB at $2.40 holds a $0.79 advantage; PRB at $0.86 is $2.33 below gas. Every coal basin except CAPP is in stronger dispatch position this week than last — driven entirely by gas moving, not coal moving. PRB’s slight slip to $15.20 from $15.60 does not alter the fundamental arithmetic at any price in this range. ARA recovering to $110.60 reverses last week’s softening; Newcastle at $132.16 holds in its settled equilibrium; AUX HCC at $238/MT for a second consecutive week at cycle high validates the global met coal demand thesis.
SECTION 3 | ELECTRIC GRID, DEMAND & COAL’S ROLE
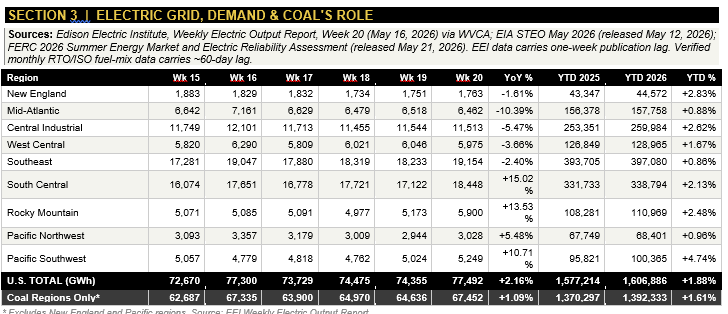
Sources: Edison Electric Institute, Weekly Electric Output Report, Week 20 (May 16, 2026) via WVCA; EIA STEO May 2026 (released May 12, 2026); FERC 2026 Summer Energy Market and Electric Reliability Assessment (released May 21, 2026). EEI data carries one-week publication lag. Verified monthly RTO/ISO fuel-mix data carries ~60-day lag.
GRID ANALYSIS: Week 20 total U.S. electrical output of 77,492 GWh is the highest single week in the six-week tracking period — driven by early summer heat in the South Central and Rocky Mountain regions. South Central at 18,448 GWh posted a +15.02% YoY gain representing roughly 2,408 additional GWh versus the same week in 2025 — approximately two full days of normal regional output in a single week’s comparison. Rocky Mountain’s 5,900 GWh and +13.53% YoY confirms data center and air conditioning demand accelerating in the Denver-to-Las Vegas corridor. This output surge is the direct driver behind Henry Hub’s 10.76% single-week spike. FERC’s 2026 Summer Assessment (May 21) reports +75 GW new generating capacity year-over-year — predominantly solar, wind, batteries — with retirements slowing to ~8 GW, partially attributable to DOE emergency orders. YTD cumulative electrical output of 1,606,886 GWh runs +1.88% ahead of 2025 — sustained demand growth that provides a genuine floor under coal dispatch economics.
SECTION 4 | U.S. STEEL PRODUCTION & MET COAL DEMAND
STEEL ANALYSIS: U.S. steel output at 1,898,000 net tons and 82.2% utilization for the second consecutive week at this level is sustained high-output, not a one-week spike. Five consecutive weeks above 1,800 KST reflect genuine order-book depth. Great Lakes at 533 KST — the highest in the six-week tracking period — is the direct demand signal for Northern Appalachian coking coal. Midwest at 313 KST and +23.72% YoY confirms integrated mills running hard. YTD production of 35.183 million tons is 6.55% above the same twenty weeks of 2025. Australian HCC at $238/MT pricing this demand at cycle highs validates investment in Appalachian underground met operations. Pennsylvania’s +2.8% YTD production is the direct operating response.
SECTION 5 | EMPLOYMENT & ECONOMIC FOOTPRINT
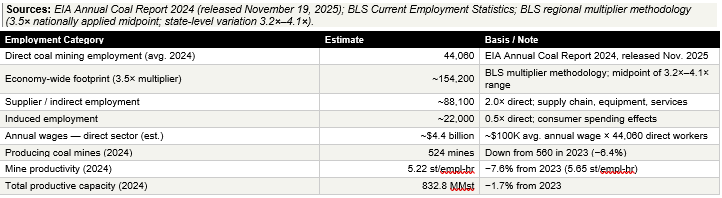
WV CAPP’s −17.77% single-week YoY production estimate is not an abstraction on the ground in Mingo, McDowell, and Wyoming counties. A southern WV underground mine with 150 direct employees represents roughly 525 economy-wide jobs through the 3.5× multiplier — payroll at the mine, mechanics at the equipment dealer, teachers whose salaries the county school board can afford because the severance tax is coming in. West Virginia’s estimated YTD shortfall of 878 KST versus 2025 translates directly to reduced Black Warrior severance tax revenue that county commissions are already marking as a budget gap. The decline in producing mines from 560 to 524 (−6.4%) and the 7.6% productivity decline signal an industry deferring capital investment because long-term contract uncertainty makes major commitments difficult to justify — a self-reinforcing cycle that does not reverse without price stability or policy certainty.
SECTION 6 | RAIL & BARGE TRANSPORTATION
RAIL PERFORMANCE ANALYSIS: CSX delivered near-perfect Appalachian coal service in Week 20: 9,722 carloads against a plan of 9,725 — a −0.03% variance within measurement error. Coke carloads surged to 1,279 from 1,099, consistent with integrated steelmakers at 82.2% utilization pulling fuel through the CSX network at elevated rates. NS NAPP finally reached plan in Week 20 at 440/440 — the first on-plan reading in the six-week tracking period for that corridor. NS Central Appalachian loading shortfall persisted: 500 actual vs. 590 planned (−15.3%). Total NS Appalachian actual of 940 vs. 1,030 planned (−8.7%) is a modest improvement from prior weeks but still represents six consecutive weeks of systematic underperformance. Producers and export customers using the NS CAPP corridor who are not maintaining their own STB EP-724 documentation are forfeiting a potential enforcement option. River barges stable at 387 total (298 NAPP, 89 CAPP) — within the spring operating range of 370–398 over six weeks.
SECTION 7 | DOMESTIC COAL INDUSTRY NEWS
Week of May 18–24, 2026. WHY IT MATTERS reflects editorial judgment of The Hedley Company.
DOE Issues 5th Emergency Order — J.H. Campbell Coal Plant Extended to August 18, 2026
U.S. Department of Energy / Michigan Public Radio / WZZM13 | May 18, 2026
WHY IT MATTERS: DOE issued its fifth Section 202(c) emergency order May 18, extending the 1,560-MW J.H. Campbell coal plant in West Olive, Michigan, through August 18, 2026 — 444 days past its planned May 2025 retirement. Consumers Energy has documented $180 million in compliance costs (~$600,000/day), charged to MISO ratepayers. The D.C. Circuit Court heard oral arguments May 15. Six plants total — five coal, one gas/oil — in Michigan, Indiana, Colorado, Washington, and Pennsylvania are now operating under similar DOE orders. If the court upholds the orders, Section 202(c) becomes a durable proactive coal fleet preservation tool. If it rules against, the legislative track — H.R. 3843, FERC DRR reform — becomes the only path. Every coal operator with a pending retirement decision should treat this litigation as the most consequential pending judicial proceeding in the sector.
FERC Releases 2026 Summer Energy Market and Reliability Assessment — +75 GW New Capacity, ~8 GW Retirements
Federal Energy Regulatory Commission / Utility Dive | May 21, 2026
WHY IT MATTERS: FERC’s summer assessment released at the May 21 open meeting under Chairman Laura Swett reports U.S. generating capacity increased ~75 GW versus last summer — predominantly solar, wind, batteries — while retirements slow to ~8 GW, partly due to DOE emergency orders. NERC simultaneously reported (May 20) that data center interconnection delays are complicating demand forecasting. In that scenario of uncertain demand arrival, dispatchable baseload — coal, gas, nuclear — is worth more than a levelized cost calculation suggests. FERC’s capacity market rules do not yet price that value correctly. The FERC DRR docket is the proceeding that could change it; the coal industry’s analytical case needs to be in that record now.
EPA CCR Public Hearing May 28 — Comment Deadline June 12: 19 Days Remaining
U.S. EPA | Ongoing
WHY IT MATTERS: Nineteen days from this report, the EPA Coal Combustion Residuals comment period closes. The proposed 2026 amendments replace prescriptive national closure standards with site-specific permitting flexibility, rescind CCRMU requirements, and revise beneficial use definitions. The prior CCR framework was cited by multiple utilities as the primary forcing function for retirement decisions that would otherwise have been deferred. The EPA CCR public hearing May 28 is the final organized input opportunity. Plant-level engineering analyses, closure cost studies, and grid reliability dependency calculations inserted into the record now are the evidence that survives judicial review later. June 12 is not a soft deadline.
Sen. Whitehouse MATS Investigation — Company Responses Due May 28
Senate EPW Committee (Minority) | May 2026
WHY IT MATTERS: Senate EPW Ranking Member Whitehouse’s document demands from 17 companies covering 30+ plants and 70 coal units holding MATS exemptions under Section 112(i)(4) are due May 28 — the same day as the EPA CCR hearing. The exemptions remain legally valid; the administration’s repeal of the 2024 MATS amendments is in parallel litigation. This is political messaging designed to build a document record for future oversight hearings. Affected operators must coordinate with legal counsel on document preservation and response scope before May 28. Treat it as document management, not a policy emergency.
EPA ELG Wastewater Rule Revisions — 60-Day Comment Window Running from May 15
Engineering News-Record / U.S. EPA | May 15, 2026
WHY IT MATTERS: EPA’s proposed Effluent Limitation Guidelines revisions replace nationally prescriptive wastewater standards with case-by-case site permitting — eliminating compliance timelines cited by multiple utilities as forcing functions for premature coal plant retirement. The 60-day comment window runs to approximately July 14. The administrative record built during this window will be the legal backbone for litigation challenges. Operators with plant-level compliance cost data should be preparing comments now.
DOE $625M Coal Fleet Investment Program — Q2/Q3 Award Announcements Approaching
U.S. Department of Energy | Ongoing 2026
WHY IT MATTERS: DOE’s three-track program ($350M recommissioning and retrofitting, $175M rural resilience, $100M multi-fuel modernization) is approaching project-level award announcements in Q2–Q3 2026. An award means extended coal purchasing commitments, deferred retirement, and continued employment and tax base in the surrounding community. Operators in PJM, MISO, and SERC with viable fleet-life extension cases who have not pre-applied are running out of time.
SECTION 8 | INTERNATIONAL COAL INTELLIGENCE
Week of May 18–24, 2026. Sources: WVCA International Price Table; ICE; Argus Media; Reuters; The Coal Hub; globalCOAL.
ARA Recovers to $110.60/MT — Reverses Prior Week’s Softening; +15.21% YoY
ICE / WVCA Weekly Report | May 16, 2026
WHY IT MATTERS: ARA benchmark thermal coal for Northwest European delivery recovered to $110.60/MT this week (+0.59% WoW), reversing last week’s modest softening. European utilities have maintained elevated coal burn throughout the year following the Hormuz LNG disruption. The +15.21% YoY premium confirms the structural European coal floor is substantially higher than pre-crisis levels. CAPP and NAPP steam grades at ARA-equivalent delivered economics remain competitive for Atlantic Basin export. U.S. East Coast producers are correctly positioned.
Newcastle Holds $132.16/MT — Settled Equilibrium at +32.84% YoY
ICE / WVCA Weekly Report | May 16, 2026
WHY IT MATTERS: Newcastle’s −0.26% WoW move to $132.16 confirms the seaborne thermal market is trading in a settled $130–135/MT equilibrium — off the March 20 high of $146.50 but showing no appetite for sustained retreat. The +32.84% YoY premium reflects a structural repricing that will not unwind on a single ceasefire signal. Korea’s April thermal coal imports were up 40% YoY; Japan’s up 2.5%. Asian utilities are running coal at structurally elevated rates. U.S. Gulf Coast and East Coast export terminals positioned to capture incremental Asian demand remain correctly placed.
AUX Australian Premium Hard Coking Coal Holds $238/MT — +26.09% YoY
Argus Media / WVCA Weekly Report | May 16, 2026
WHY IT MATTERS: AUX HCC holding at $238/MT for a second consecutive week at cycle high — and +26.09% YoY — validates the structural met coal demand case at the prices that matter for investment decisions. Multiple institutional bidders in Anglo American’s Queensland met coal asset sale process at these levels confirms the demand thesis. U.S. Appalachian met coal participates in the same global market shift at a structural discount to AUX. Pennsylvania’s +2.8% YTD production is the operating response. The Great Lakes and Midwest steel districts at 82.2% utilization are the demand pull.
India Coal Demand Structurally Robust — NITI Aayog Projects Doubling by 2050
NITI Aayog / globalCOAL | 2026
WHY IT MATTERS: India’s government policy institution projects coal demand could more than double by 2050 — driven by steel, cement, and manufacturing industrialization at a scale no renewables buildout displaces in the relevant horizon. U.S. Appalachian met coal is among the few non-Australian, non-Russian sources of premium coking coal that can serve Indian integrated steel mills at scale. Building India market positioning over a five-to-ten-year horizon is the highest-return strategic action available to U.S. met coal producers operating today.
Six weeks into the second quarter, one data point reshapes the week’s narrative more than any other: Henry Hub at $3.19/MMBtu. The summer arrived early in the South Central grid. Electrical output spiked 15% in that region in a single week. Gas prices responded with a 10.76% single-week move. Coal’s economic position improved across every basin except CAPP — and even CAPP’s dispatch disadvantage narrowed from $0.60 to $0.29 per MMBtu in seven days. That is not a trend yet; it is a data point. But EIA’s Q3 CDD forecast of +8% vs. 2025 suggests the summer will run warmer than last year. If that materializes and Henry Hub holds above $3.00 through July and August, the gas price environment that has been suppressing coal dispatch economics for the past two quarters becomes materially friendlier. Watch Henry Hub in the coming weeks. It is the most important number in the report.
The production numbers require honest reading. U.S. estimated total at 9,541 KST is the EIA figure derived from AAR carloads and confirmed through WVCA — the third consecutive week of recovery. But the YoY comparison at −5.76% is the weakest in recent weeks, and the YTD deficit widened to −0.4%. WV CAPP’s estimated collapse to 634 KST and −17.77% YoY is the number most likely to generate questions: one week of that magnitude in underground Appalachian production can be operational scheduling rather than structural market withdrawal. The next two weeks will tell. If WV CAPP recovers toward 650–670 KST, Week 20 was an outlier. If it stays at 630 or below, the structural picture is worse than the YTD average suggests.
Steel at 1,898,000 net tons and 82.2% utilization — second consecutive week at these levels — is no longer a record reading but a sustained operating rate. The Great Lakes and Midwest met coal demand signal is real and running hard. CSX’s near-perfect Appalachian execution confirms the supply chain from WV and PA mines to Hampton Roads and Baltimore is functioning. Norfolk Southern’s CAPP shortfall at −15.3% is the constraint that matters most for producers trying to move incremental tons to export. Six weeks of documented plan shortfall is the record that makes an STB complaint viable. Build it.
The regulatory calendar demands action in the next nineteen days. June 12 arrives before the next issue of this report. The EPA CCR comment record closes then; the ELG window continues running toward July 14. The administration has proposed the right frameworks. The industry’s obligation is specific, documented, plant-level evidence in those records — not sentiment, not template comments. Engineering studies. Financial analyses. Grid reliability dependency calculations. Employment and tax base multipliers attached to real facility names and real production numbers. The comment that says “we support this rule” is noise. The comment with attached analysis is the administrative record that survives judicial review.
The D.C. Circuit Campbell litigation is the most consequential pending judicial proceeding in coal policy. Five orders, 444 days, $180 million in documented ratepayer costs, and a panel that heard arguments on May 15. The ruling will arrive on its own schedule. Every coal operator with a pending retirement question should be prepared for both outcomes. The administration has demonstrated what it is willing to do with emergency authority. Whether courts permit it defines the operating environment for every plant with a retirement date on the calendar.
Bottom line: summer heat improved the gas-price backdrop for coal dispatch; WV CAPP delivered a number that requires watching over the next two weeks; steel is at a six-year high with met coal fundamentals strong; export pricing windows are open; two regulatory comment deadlines require action now; and the Campbell litigation is the pivot point of coal fleet policy. The operators in the regulatory records when June 12 closes have more options than those who are not. That is a concrete choice available right now.
By T.L. Headley, MBA,
President
The Hedley Company
PRIMARY SOURCES — WEEK ENDING MAY 24, 2026
1. WVCA Weekly Production/Consumption Report, Week 20 (May 16, 2026), Jason Bostic, WVCA — primary data source for all production, price, rail, barge, electrical, and steel data. Presents EIA weekly production estimates with one-week publication lag.
2. U.S. EIA, Weekly Coal Production Report (DOE/EIA-0218), Week 20 (May 16, 2026), released May 22, 2026 — state and regional production estimates via AAR railcar allocation methodology; preliminary, subject to MSHA quarterly revision.
4. U.S. EIA, Natural Gas Weekly Update — Henry Hub $3.19; NY Hub $2.79; Chicago $2.71; Cal Avg $2.34; Average $2.76 (Week 20, May 16, 2026); one-week publication lag.
5. Edison Electric Institute, Weekly Electric Output Report, Week 20 (May 16, 2026) via WVCA — regional output in GWh; one-week publication lag.
6. American Iron and Steel Institute (AISI), AIS-7 weekly, week ending May 16, 2026, released May 20, 2026 — production by district, capacity utilization, YTD figures.
7. Association of American Railroads (AAR), Weekly Railroad Traffic Report, Week 20 (May 16, 2026), released May 20, 2026 — all commodity carload and intermodal data.
8. Federal Surface Transportation Board, Form EP-724 — CSX and Norfolk Southern weekly coal carloads, plan vs. actual (Week 20, May 16, 2026).
9. ICE / WVCA Weekly Report — Newcastle $132.16/MT; ARA $110.60/MT; AUX Met Coal $238.00/MT (May 16, 2026).
10. U.S. EIA, Short-Term Energy Outlook, May 2026 (released May 12, 2026) — coal consumption/inventory forecasts, CDD projections, delivered coal cost, generation share estimates.
11. U.S. EIA, Annual Coal Report 2024 (released November 19, 2025) — employment, productivity, mine count, capacity (Section 5).
12. FERC, 2026 Summer Energy Market and Electric Reliability Assessment (released May 21, 2026).
13. U.S. DOE, 5th Emergency Order, J.H. Campbell Plant (Michigan), May 18, 2026; extended to August 18, 2026. Michigan Public Radio / WZZM13, May 18–19, 2026.
14. D.C. Circuit Court of Appeals — oral arguments on Campbell Section 202(c) challenge, May 15, 2026.
15. Engineering News-Record — “EPA Moves to Ease Coal Plant Wastewater Rules,” May 15, 2026.
16. U.S. EPA — 2026 Proposed CCR Amendments; hearing May 28; comment deadline June 12.
17. Senate EPW Committee (Minority) — Whitehouse MATS investigation; responses due May 28, 2026.
18. NERC / Utility Dive — Data Center Interconnection Delays report, May 20, 2026.
19. NITI Aayog / globalCOAL — India long-range coal demand structural assessment, 2026.
AI Assistance Disclosure: AI assistance was used in research compilation, data formatting, and drafting under the author’s editorial direction. All production, price, rail, barge, electrical, and steel data sourced from the WVCA Weekly Production/Consumption Report (Week 20, May 16, 2026), Jason Bostic, WVCA, and other verified primary sources as cited. EIA weekly coal production data are estimates based on AAR railcar loading data and carry an approximately one-week publication lag; they are preliminary and subject to revision when MSHA quarterly data is finalized. EIA coal and natural gas spot prices similarly reflect the prior week. All editorial judgments, strategic assessments, and analytical conclusions are the author’s own. Readers should verify data directly with cited sources.
Coal Currents | Published by The Hedley Company | 169 Raceview Drive, Ona, WV 25545 | [email protected] | Ph. 681.356.1776