


A Publication of the Hedley Company: Communications and Research for Energy
Feb 08, 2026

Executive Summary
This weekly report synthesizes key developments across U.S. coal production, electric power generation and demand, steel manufacturing, and rail and barge transportation. The analysis reflects data releases in early February 2026 and captures the operational impacts of persistent winter weather, including Winter Storm Fern in late January.
Severe cold, ice, and transportation disruptions materially affected production and logistics while reinforcing the importance of dispatchable energy—particularly coal and natural gas—in maintaining grid reliability during peak demand.
Coal Production
(EIA Weekly Coal Production Report – Released February 5, 2026)
U.S. coal production declined sharply during the week ended January 31, reflecting weather-related disruptions across major producing regions.
Weekly production totaled 8,885 thousand short tons, down 15.0% week-over-week and 18.1% year-over-year, marking a near one-year low.
Declines were broad-based, led by major producing states, including:
Wyoming: −13.8% week-over-week
West Virginia: −12.7% week-over-week
Year-to-date production rose modestly by 2.2% to 45,846 thousand short tons.
Trailing 52-week output increased 4.4% to 532,627 thousand short tons, reflecting prior-year strength.
Coal rail loadings fell to 50,189 cars, down sharply as lower output and severe weather constrained movements.
Electricity Generation, Demand, and Operational Margins
Extreme cold associated with Winter Storm Fern significantly increased electricity demand and strained regional power systems.
Coal-fired generation surged 31% week-over-week (week ending January 25, with carryover effects), driven by peak heating demand.
Coal’s national generation share increased to approximately 21%, up from 17%, trailing natural gas (38–40%) but exceeding renewable output, which declined due to weather conditions.
Natural gas generation rose 14%, while nuclear generation remained stable at roughly 18%.
Peak system loads approached record levels in several regions, including PJM, which neared 148 GW. Reserve margins tightened, congestion increased, and petroleum-fired generation was dispatched in constrained regions such as New England.
While no widespread blackouts occurred, system margins were stressed. Coal and natural gas generation proved essential to maintaining reliability during peak conditions.
Steel Production and Demand
(AISI Weekly Report)
U.S. steel production showed modest short-term softness but continued year-over-year strength.
Raw steel production totaled 1,758,000 net tons, down 1.1% week-over-week but up 3.4% year-over-year.
Capacity utilization averaged 76.0%, slightly below the prior week’s 76.9%.
Year-to-date production reached 7,774,000 net tons, up 3.4% year-over-year.
Demand remains supported by manufacturing, infrastructure investment, and protective trade measures. Industry forecasts call for approximately 1.8% growth in 2026. Employment in iron and steel manufacturing remains steady at roughly 72,400 workers.
Rail and Barge Transportation
(AAR and USACE Context)
Transportation volumes declined sharply, driven by weather disruptions across the Midwest and Eastern U.S.
Total rail traffic fell to 434,361 carloads and intermodal units, down 15.5% year-over-year.
Carloads: 191,188 (−14.0%)
Intermodal units: 243,173 (−16.6%)
Coal loadings declined significantly, down 9,888 cars week-over-week to 50,189.
Grain was the only major commodity posting gains.
Year-to-date rail trends remain mixed, with carloads up 4.4% and intermodal traffic down 3.5%.
Barge traffic was also constrained by ice conditions. Lock slowdowns and halted movements—particularly along the Illinois River—reduced grain tonnages and are expected to continue limiting flows into early February.
Overall Insights
Winter weather materially amplified coal’s role in meeting surging electricity demand while simultaneously suppressing coal production and bulk commodity transportation. Steel production demonstrated relative resilience, supported by protected domestic demand, while rail and barge disruptions highlighted ongoing supply chain vulnerabilities.
These conditions underscore the continuing importance of dispatchable energy resources for grid reliability, particularly amid rising structural demand pressures from electrification and data center growth. While underlying industrial activity remains broadly positive, short-term trends continue to be dominated by weather volatility and seasonal effects.
This report provides an integrated view of U.S. energy, metals, and logistics conditions as of February 7, 2026.
Domestic News
• Title: Energy chief Wright says orders empowering coal plants helped keep lights on during winter storm
Source: New Haven Register (AP story)
Date: February 6, 2026
Summary: Energy Secretary Chris Wright credited Trump administration emergency orders keeping aging coal plants operational for preventing major blackouts during a recent frigid weather event, with coal providing 24% of peak generation behind natural gas. Critics argue the orders overlook renewables’ role and could add billions in costs for utility customers.
Why It Matters: This highlights ongoing policy efforts to extend coal plant life for grid reliability amid extreme weather, but it raises debates over long-term costs and energy mix priorities in the US.
URL: https://www.nhregister.com/news/politics/article/energy-chief-wright-says-orders-empowering-coal-21338509.php
• Title: Energy Chief Wright Says Orders Empowering Coal Plants Helped Keep Lights on During Winter Storm
Source: U.S. News & World Report (AP story)
Date: February 6, 2026
Summary: The Trump administration highlighted emergency orders to maintain coal-fired plants as key to avoiding power shortages during a widespread cold snap, citing coal’s 24% contribution to peak electricity supply. Opposition from some utilities and experts points to potential high costs from overriding retirements.
Why It Matters: It underscores coal’s claimed role in winter grid stability under current policies, influencing future decisions on plant retirements versus extensions.
URL: https://www.usnews.com/news/politics/articles/2026-02-06/energy-chief-wright-says-orders-empowering-coal-plants-helped-keep-lights-on-during-winter-storm
• Title: Trump’s Push to Save the Coal Industry Is Facing Opposition From the Coal Industry
Source: NOTUS
Date: February 3, 2026
Summary: Owners of Colorado’s Craig Generating Station protested a Trump administration order forcing a unit to stay open past retirement, arguing it violates their rights and imposes unnecessary costs. This is part of broader efforts to delay coal plant closures amid industry decline.
Why It Matters: Even within the coal sector, forced extensions create pushback over economics and operations, showing tensions in revival policies.
URL: https://www.notus.org/energy/trump-coal-industry-opposition-colorado
• Title: Trump is using emergency powers to keep aging coal plants open. It could increase your bill
Source: CNN
Date: February 5, 2026
Summary: The administration has blocked retirements at multiple aging coal plants using emergency authority, claiming it saves costs, but analysis estimates $3-6 billion in added ratepayer expenses by 2028 due to higher maintenance and inefficiency.
Why It Matters: This policy shift could significantly impact electricity prices and consumer bills while attempting to bolster coal’s role in the energy mix.
URL: https://www.cnn.com/2026/02/05/climate/trump-aging-coal-plants-electricity-bills
• Title: Coal industry workers could get preferential hiring for new jobs under Colorado lawmakers’ bill
Source: Summit Daily
Date: February 5, 2026 (or early February coverage)
Summary: Colorado’s Senate Bill 52 proposes hiring preferences for displaced coal workers in construction, rail, utilities, and manufacturing to ease transitions in rural areas moving away from coal. It addresses economic upheaval from plant closures amid federal efforts to sustain the industry.
Why It Matters: State-level support for workforce transition contrasts with federal pro-coal pushes, highlighting regional impacts on jobs and communities.
URL: https://www.summitdaily.com/news/colorado-bill-coal-industry-workers-preferential-hiring
• Title: Fedorchak votes to speed up domestic mining and strengthen America’s mineral independence
Source: Office of Congresswoman Julie Fedorchak
Date: February 4, 2026
Summary: Rep. Fedorchak supported the Critical Mineral Dominance Act to streamline permitting and prioritize domestic mining projects, reducing foreign reliance, with ties to North Dakota’s coal-related mineral processing efforts.
Why It Matters: While focused on critical minerals, it intersects with coal regions by diversifying economies and supporting infrastructure in coal-heavy states.
URL: https://fedorchak.house.gov/media/press-releases/fedorchak-votes-speed-domestic-mining-and-strengthen-americas-mineral
• Title: US Coal Mining Industry Report 2026: Detailed Information on Reserves, Production, Competitive Landscape...
Source: Yahoo Finance (Research and Markets)
Date: February 3, 2026
Summary: The report forecasts modest 2025 US coal production growth from delayed retirements and demand factors, but expects declines in 2026 as renewables advance, with policy supports like reduced royalties aiding short-term output.
Why It Matters: It provides outlook on production trends, showing policy’s temporary lift against longer-term structural challenges in domestic coal.
URL: https://finance.yahoo.com/news/us-coal-mining-industry-report-145000368.html
• Title: Peak coal may be elusive, but peak seaborne coal is here
Source: Reuters
Date: February 4, 2026
Summary: Global coal demand hit records in 2025, but shifts like increased domestic production in China and India reduced import needs, with implications for US export markets.
Why It Matters: While focused globally, it affects US domestic coal via export demand, a key support for producers amid internal power sector declines.
URL: https://www.reuters.com/markets/commodities/peak-coal-may-be-elusive-peak-seaborne-coal-is-here-2026-02-04
• Title: Today in Energy - Coal-fired generation rose to meet demand during Winter Storm Fern
Source: U.S. Energy Information Administration (EIA)
Date: January 28, 2026 (recent update/viewed in early February context)
Summary: Coal generation in the Lower 48 states surged 31% during Winter Storm Fern to meet heightened demand, contrasting with lower use earlier in January.
Why It Matters: Official data reinforces coal’s dispatchable value during peaks, supporting arguments for maintaining capacity domestically.
URL: https://www.eia.gov/todayinenergy/detail.php?id=67084
• Title: Energy Department Prevented Blackouts & Saved American Lives During Winter Storms
Source: U.S. Department of Energy
Date: February 2026 (recent statement)
Summary: The DOE credited Trump administration actions, including saving coal plants from closure, with averting blackouts and saving lives during storms by ensuring reliable generation.
Why It Matters: This official narrative emphasizes coal’s reliability benefits under current policies, shaping public and regulatory views on industry support.
URL: https://www.energy.gov/articles/energy-department-prevented-blackouts-saved-american-lives-during-winter-storms
International News
• Title: Death toll from coal mine blast in India’s northeast rises to 27
Source: Xinhua
Date: February 7, 2026
Summary: A methane explosion at an illegal coal mine in Meghalaya’s East Jaintia Hills district killed at least 27 miners, with search and rescue operations continuing amid difficult conditions in the flooded underground site. Authorities are investigating safety violations common in unregulated small-scale mines in the region.
Why It Matters: Tragedies in India’s informal coal sector highlight persistent safety risks, regulatory enforcement gaps, and human costs in a country heavily reliant on coal for energy and jobs.
URL: https://english.news.cn/asiapacific/20260207/cf20e43dd9ef4383943cadd9d768aec3/c.html
• Title: Government considers maximum coal export duty of 8%, tiered tariff scheme to be implemented
Source: Tanah Air
Date: February 7, 2026
Summary: Indonesia’s government is drafting policies for a new coal export levy up to 8% and a tiered tariff structure to boost state revenue from the sector, potentially applicable retroactively from early 2026. The measures aim to capture more value from exports amid fluctuating global prices.
Why It Matters: As the top thermal coal exporter, Indonesia’s fiscal changes could raise costs for Asian importers, affect producer margins, and influence global supply dynamics.
URL: https://tanahair.net/government-considers-maximum-coal-export-duty-of-8-tiered-tariff-scheme-to-be-implemented
• Title: Danantara delays coal-to-DME project groundbreaking
Source: Petromindo
Date: February 7, 2026
Summary: Indonesia’s sovereign wealth fund Danantara postponed the groundbreaking for a major coal-to-dimethyl ether (DME) gasification project, citing unspecified delays in preparations or approvals. The initiative seeks to convert coal into cleaner fuels for domestic use.
Why It Matters: Coal-to-chemicals projects represent Indonesia’s push for downstream value addition, but delays signal challenges in execution amid energy transition pressures.
URL: https://www.petromindo.com/news/article/danantara-delays-coal-to-dme-project-groundbreaking
• Title: China’s solar capacity set to overtake coal this year
Source: Semafor
Date: February 5, 2026
Summary: China’s installed solar power capacity is projected to surpass coal-fired capacity in 2026, with renewables (wind, solar, hydro, nuclear) reaching about two-thirds of the power mix by year-end, despite record coal plant proposals in 2025. This reflects massive clean energy additions amid growing power demand.
Why It Matters: As the world’s largest coal user, China’s renewables surge could peak domestic coal demand sooner, influencing global coal markets and emissions trajectories.
URL: https://www.semafor.com/article/02/05/2026/chinas-solar-capacity-set-to-overtake-coal-this-year
• Title: Russian metallurgical coal prices in Asia rise by 6.4% in early 2026
Source: TASS
Date: February 6, 2026
Summary: Russian coking coal prices to Asian markets increased 6.4% since January 2026, reaching $141.5 per ton at Far Eastern ports, with global met coal benchmarks also rising significantly year-on-year. Growth is attributed to demand in steel-producing nations like China and India.
Why It Matters: Met coal price gains support Russian exporters facing sanctions, while signaling sustained steel demand in Asia that bolsters international coal trade.
URL: https://tass.com/economy/2083123
• Title: Opinion: When good intentions risk going off track: The risks of coal production cuts in 2026
Source: Petromindo
Date: February 3, 2026
Summary: An analyst warns that Indonesia’s proposed 2026 coal output reductions, intended to stabilize prices, could lead to economic fallout like job losses and reduced revenues if not carefully managed. The piece urges balanced policy to avoid over-correction in a volatile market.
Why It Matters: Production quota debates in Indonesia could reshape export volumes, affecting global thermal coal availability and prices for key Asian buyers.
URL: https://www.petromindo.com/news/article/opinion-when-good-intentions-risk-going-off-track-the-risks-of-coal-production-cuts-in-2026
• Title: Global coal prices diverge: Europe firmer, China softer, metallurgical coal surges
Source: The Coal Hub
Date: February 2, 2026 (updated/ongoing coverage into early February)
Summary: European coal prices strengthened on cold weather and low stocks, while Chinese spot prices softened despite inventory draws; Australian metallurgical coal continued upward momentum above $250/t. Regional factors drove the mixed trends.
Why It Matters: Diverging prices reflect varying demand pressures, with met coal strength aiding producers and thermal variations impacting power costs in Europe and Asia.
URL: https://thecoalhub.com/global-coal-prices-diverge-europe-firmer-china-softer-metallurgical-coal-surges.html
• Title: China’s coal power proposals surge to record high, risk years of embroilment not aligned with goals
Source: Petromindo (citing CREA/Global Energy Monitor report)
Date: Early February 2026
Summary: China saw a record 161 GW of new coal power proposals in 2025, potentially locking in excess capacity and lower utilization rates even as renewables grow rapidly. This creates long-term misalignment with carbon goals despite short-term energy security needs.
Why It Matters: Overbuilding coal plants amid clean energy boom could strand assets and slow emissions reductions in the world’s top coal consumer.
URL: https://www.petromindo.com/news/article/china-s-coal-power-proposals-surge-to-record-high-risk-years-of-embroilment-not-aligned-with-goals
• Title: Market Interest Test – Coal Operational Allocation ELA 7005
Source: NSW Resources (Australia)
Date: February 6, 2026
Summary: New South Wales opened public consultation on a coal exploration licence application for operational purposes at Wilpinjong Coal, with submissions due by mid-March 2026. The process assesses market interest under mining regulations.
Why It Matters: Australian state-level approvals sustain domestic production and exports, supporting jobs in key mining regions amid global transition debates.
URL: https://www.resources.nsw.gov.au/news-articles/market-interest-test-%E2%80%93-coal-operational-allocation-ela-7005
• Title: Czech Republic to shut final hard-coal mine by 2026
Source: Energies Media
Date: Early February 2026 (ongoing coverage from late 2025 plan)
Summary: The Czech government confirmed plans to close the country’s last hard-coal mine near the Polish border by end-2026, ending centuries of mining in the region. The decision aligns with EU decarbonization and energy security shifts.
Why It Matters: This marks a milestone in Europe’s coal phase-out, with implications for regional economies, workforce transitions, and broader continental energy policy.
URL: https://energiesmedia.com/czech-republic-to-shut-final-hard-coal-mine
Weekly Legislative, Regulatory and Judicial Update
Title/Description: Trump EPA Final Rule Delays Coal Ash Groundwater Monitoring and Cleanup Until 2031-2032
Source: E&E News (POLITICO) / Earthjustice
Date: February 6, 2026
Summary: The EPA issued a final rule extending compliance deadlines for groundwater monitoring and investigation at hundreds of unregulated coal ash impoundments to 2031 or later, more than doubling the initial proposed extension. The change comes just before a reporting deadline for previously unregulated sites and is framed as promoting grid reliability amid coal plant extensions.
Why It Matters: This regulatory relief reduces near-term compliance costs for coal plant operators but delays environmental protections against toxic coal ash leaks, potentially increasing long-term risks to water quality and public health while supporting administration efforts to sustain coal operations.
URL: https://www.eenews.net/articles/final-epa-rule-more-than-doubles-groundwater-monitoring-deadline-extension-for-some-coal-ash-dumps
Title/Description: Energy Secretary Wright Credits Emergency Coal Plant Orders for Preventing Blackouts During Winter Storm
Source: Associated Press (via U.S. News & World Report / KSAT)
Date: February 6, 2026
Summary: Secretary Chris Wright highlighted DOE’s use of Federal Power Act Section 202(c) emergency orders to keep aging coal plants operational, crediting them (along with natural gas) for grid stability during recent extreme cold, where coal supplied 24% of peak generation. Critics argue the orders ignore renewables’ contributions and impose high costs.
Why It Matters: It reinforces the administration’s justification for overriding retirements via emergency authority, shaping ongoing debates over grid reliability, consumer costs, and coal’s role in winter energy security.
URL: https://www.usnews.com/news/politics/articles/2026-02-06/energy-chief-wright-says-orders-empowering-coal-plants-helped-keep-lights-on-during-winter-storm
Title/Description: House Passes GOP-Led Bill (H.R. 4090) to Expand Mining on Federal Lands
Source: Bloomberg Law / POLITICO Pro
Date: February 4-5, 2026
Summary: The House approved legislation codifying Trump executive actions to accelerate mining permits, prioritize “priority projects,” survey federal lands for hardrock/mineral development, and rescind burdensome rules, passing 224-195 with some Democratic support. The bill now heads to the Senate.
Why It Matters: While focused on critical minerals, it intersects with coal by easing federal land access and permitting in coal-heavy regions (e.g., Western states), supporting broader domestic energy production goals amid coal revival efforts.
URL: https://news.bloomberglaw.com/health-law-and-business/gop-led-bill-to-expand-us-mining-passes-house-heads-to-senate
Title/Description: Utility Pushback Against DOE Coal Plant Mandate: Petition to Reconsider Craig Station Order
Source: NOTUS / Industrial Info
Date: February 3-6, 2026
Summary: Owners of Colorado’s Craig Generating Station (including Xcel Energy and PacifiCorp) petitioned DOE for rehearing on a December 2025 emergency order forcing a unit to stay open past retirement, calling it a rights violation and cost imposition. This reflects broader industry opposition to forced extensions.
Why It Matters: Even coal stakeholders resist mandates that override economic decisions, highlighting tensions in the administration’s pro-coal policies and potential for legal/regulatory challenges.
URL: https://www.notus.org/energy/trump-coal-industry-opposition-colorado (related coverage)
Title/Description: Keeping Coal on Life Support: Analysis of Trump Policies and Industry Health
Source: Legal Planet
Date: February 2, 2026 (updated/ongoing into early February)
Summary: The piece critiques administration actions like reduced federal coal lease royalties, expedited reviews, mandatory plant extensions, and environmental exemptions as subsidizing an uneconomic industry, noting doubled coal stock prices but declining employment.
Why It Matters: It frames current regulatory/legislative efforts as short-term life support amid structural decline, influencing public and investor perceptions of coal policy sustainability.
URL: https://legal-planet.org/2026/02/02/keeping-coal-on-life-support
Title/Description: Ongoing Challenges to DOE 202(c) Orders for Coal Plant Extensions (e.g., Michigan’s J.H. Campbell)
Source: Environmental Defense Fund / Sierra Club
Date: Ongoing coverage (extensions through February 2026)
Summary: Third extensions for plants like Michigan’s J.H. Campbell (to February 17, 2026) face lawsuits from states (MI, MN, IL) and groups alleging illegality under Federal Power Act; similar orders affect Indiana, Washington, and Colorado facilities.
Why It Matters: Judicial scrutiny of emergency authority could limit DOE’s ability to delay retirements, affecting coal capacity availability and setting precedents for future grid emergency claims.
URL: https://www.edf.org/media/trump-administration-illegally-extends-michigan-coal-plant-third-time-despite-staggering
�� Title/Description: Federal Judge Strikes Down Texas Anti-ESG Law (S.B. 13) Targeting Fossil Fuel Critics
Source: The New York Times / ESG Dive
Date: February 5, 2026
Summary: U.S. District Judge Alan Albright ruled Texas’s law barring state investments in firms “boycotting” fossil fuels unconstitutional under First and Fourteenth Amendments, blocking enforcement after a challenge by sustainable business groups.
Why It Matters: The ruling protects investor speech on fossil fuels (including coal), potentially easing pressure on financial institutions and indirectly supporting coal-related investment amid anti-ESG pushback.
URL: https://www.nytimes.com/2026/02/05/climate/texas-esg-lawsuit.html
Title/Description: EPA Delays Coal Ash Cleanup in Advance of Broader Rollback
Source: Earthjustice
Date: February 6, 2026
Summary: The new EPA rule delays investigation/monitoring of toxic coal ash at power plants until 2032, seen as prelude to larger deregulatory moves favoring coal operations.
Why It Matters: It lowers immediate burdens on coal utilities but raises environmental justice concerns in coal communities, aligning with administration priorities to reduce coal-related compliance costs.
URL: https://earthjustice.org/press/2026/trump-epa-delays-cleanup-of-hundreds-of-coal-ash-dumps-in-advance-of-larger-rollback
Title/Description: DOE Emphasizes Coal’s Role in Grid Reliability Post-Winter Storm
Source: U.S. Department of Energy (fact sheets/statements)
Date: Early February 2026 (post-storm coverage)
Summary: DOE highlighted emergency orders and coal’s 24% peak contribution during Winter Storm Fern, tying into broader “ending the war on clean coal” narrative with reversed Biden-era policies.
Why It Matters: Reinforces regulatory support for coal via emergency powers, influencing future permitting, extensions, and opposition from utilities/states.
URL: https://www.energy.gov/articles/fact-sheet-department-energy-ending-war-beautiful-clean-coal
Title/Description: Ongoing Federal Mining Reforms and Coal Intersections (e.g., Reduced Royalties)
Source: Yahoo Finance / ICLG Mining Report
Date: February 3, 2026 (report context)
Summary: Government measures like reduced federal coal royalties (to 7%) and tax credits continue from 2025, with new mining bills accelerating federal land access potentially benefiting coal-adjacent projects.
Why It Matters: These provide short-term fiscal relief to producers amid production growth forecasts, countering decline but facing long-term transition pressures.
URL: https://finance.yahoo.com/news/us-coal-mining-industry-report-145000368.html
Weekly U.S. Coal Production Report: Week Ending January 31, 2026
Overview
This report summarizes U.S. coal production data for the week ending January 31, 2026, based on the U.S. Energy Information Administration (EIA) Weekly Coal Production Report (DOE/EIA 0218/5), released on February 5, 2026. The data provides estimates of coal production in thousand short tons by producing region, state, and coal type. Comparisons are included to the prior week (ending January 24, 2026), the corresponding week last year (ending February 1, 2025), year-to-date (YTD) figures through January 31, 2026 versus January 31, 2025, and rolling 52-week totals ending January 31, 2026 versus February 1, 2025.
Key highlights for the week:
• Total U.S. coal production decreased significantly from the prior week but was down only modestly from the prior year’s comparable week.
• Production was driven primarily by Western regions, with Wyoming leading all states.
• Railroad car loadings, a proxy for coal transportation, also declined week-over-week, aligning with lower output.
All figures are in thousand short tons unless otherwise noted. Totals may not sum exactly due to independent rounding.
Total U.S. Coal Production
For the week ending January 31, 2026, total U.S. coal production was 8,885 thousand short tons. This represents a decrease of 15.0% from the prior week’s 10,451 thousand short tons and an 18.1% decline from the 10,855 thousand short tons produced in the comparable week last year (ending February 1, 2025).
• Year-to-Date (YTD) through January 31, 2026: 45,846 thousand short tons, up 2.2% from 44,845 thousand short tons in the prior YTD period (through January 31, 2025).
• Rolling 52 Weeks Ending January 31, 2026: 532,627 thousand short tons, a 4.4% increase from 510,015 thousand short tons in the prior 52-week period (ending February 1, 2025).
Railroad cars loaded with coal for the week totaled 50,189, down 14.9% from 58,954 the prior week and 16.2% from 59,863 last year. YTD car loadings were 257,321 (up 3.7% from last YTD), and 52-week loadings reached 3,040,012 (up 3.6%).
Production by Major Regions
U.S. coal production is divided into three primary regions: Appalachian, Interior, and Western. The Western region dominated output, accounting for approximately 54% of the weekly total.
•
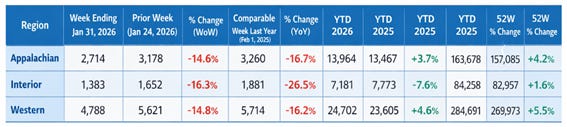
Appalachian Region: Production fell week-over-week, with notable declines in Pennsylvania and West Virginia. This region includes states like Alabama, Eastern Kentucky, Maryland, Ohio, Pennsylvania, Tennessee (not separately listed), Virginia, and West Virginia.
• Interior Region: The sharpest weekly decline, driven by lower output in Illinois and Indiana. States include Arkansas (not listed), Illinois, Indiana, Iowa (not listed), Kansas (not listed), Western Kentucky, Louisiana, Mississippi, Missouri, Oklahoma, and Texas.
• Western Region: Despite a decline, this region showed resilience in YTD and 52-week growth. Key contributors include Wyoming, Montana, and North Dakota.
Production by State
Production varied widely by state, with Wyoming far outpacing others. Below is a breakdown for states with production over 100 thousand short tons in the week, plus select others for context.
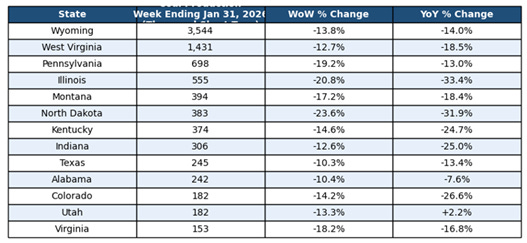
• Notable Trends: Utah showed a rare year-over-year weekly increase (+2.2%), with strong YTD (+26.9%) and 52-week (+30.5%) growth. Conversely, North Dakota and Illinois experienced the largest weekly declines. Smaller producers like Oklahoma reported negligible output (denoted as “.”), and Missouri was minimal at 1 thousand short ton.
Production by Coal Type and Geography
• Bituminous and Lignite: 8,833 thousand short tons (99.4% of total), down 15.0% week-over-week and 18.2% year-over-year. YTD: +2.2%; 52 Weeks: +4.4%.
• Anthracite: 53 thousand short tons (0.6% of total), down 10.2% week-over-week and 11.7% year-over-year. YTD: +7.2%; 52 Weeks: +1.8%.
Geographic splits:
• East of Mississippi River: 3,846 thousand short tons (43.3% of total), down 15.5% week-over-week and 20.7% year-over-year. YTD: -0.8%; 52 Weeks: +2.8%.
• West of Mississippi River: 5,039 thousand short tons (56.7% of total), down 14.6% week-over-week and 16.0% year-over-year. YTD: +4.7%; 52 Weeks: +5.7%.
Key Insights and Context
• Weekly Declines: The broad week-over-week drop may reflect seasonal factors, such as post-holiday demand adjustments or weather-related operational challenges, though specific causes are not detailed in the data.
• Growth in Key Metrics: Despite the weekly dip, YTD and 52-week figures show modest overall growth, particularly in Western states and bituminous/lignite categories, suggesting resilience amid energy market shifts.
• Regional Disparities: Western dominance continues, supported by large-scale operations in Wyoming. Appalachian and Interior regions lag in weekly performance but show mixed longer-term trends.
Data Notes
• Railroad car loadings are not prorated daily and may include slight overlaps or extras in YTD/52-week aggregates.
• “s” indicates values less than 0.5 but included in totals; “NM” for changes over 200%; “--” for not applicable.
• Sources: Association of American Railroads (car loadings) and Mine Safety and Health Administration (production estimates).
• Monthly estimates are typically released the first full week of the following month.
For the next update, refer to the EIA release scheduled for February 12, 2026. If additional analysis or historical comparisons are needed, please provide further details.
U.S. Coal Prices Report: January 2026 Spot Market Overview
Executive Summary
This report provides an analysis of U.S. domestic coal commodity spot prices based on data from the U.S. Energy Information Administration (EIA) Coal Markets report, released on February 2, 2026 (covering weeks ending January 2 through January 30, 2026). Prices are reported for key coal-producing regions and specifications, in both dollars per short ton and dollars per million British thermal units (mmBtu). The data reflects prompt quarter delivery prices, sourced from S&P Global with permission.
Key observations:
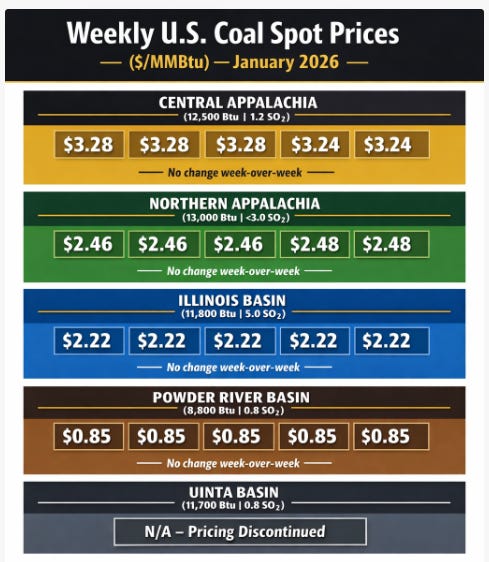
• Spot prices across major regions remained remarkably stable throughout January 2026, with minimal week-to-week changes.
• Central Appalachia saw a slight decline mid-month, while Northern Appalachia experienced a minor increase; other regions were unchanged.
• Prices are influenced by factors such as heat content (Btu per pound), sulfur dioxide (SO2) content, and regional supply-demand dynamics.
• No data is available for Uinta Basin coal, as EIA discontinued collecting and reporting that price series after April 12, 2024 (last recorded at $25.30 per short ton).
• Broader context includes steady monthly coal exports (averaging 8–10 million short tons in recent months through July 2025) and coke exports (200–500 thousand short tons), as shown in EIA charts. NYMEX coal futures are no longer published by EIA; users are directed to the CME Group for futures data.
All prices are average weekly spot prices for prompt quarter delivery (the quarter following the current quarter). Historical data for these series is proprietary to S&P Global and not publicly released by EIA.
Spot Prices in Dollars per Short Ton
The table below summarizes average weekly spot prices in dollars per short ton for select coal types and regions. Prices reflect the specified Btu and SO2 content, which affect usability in power generation and compliance with environmental regulations.
• Trends: Central Appalachia prices dipped $1.00 mid-January but stabilized. Northern Appalachia saw a $0.50 uptick in the latter half of the month. Illinois Basin and Powder River Basin prices were flat, indicating consistent supply and demand in these subbituminous and bituminous coal hubs.
• Regional Insights: Higher-Btu coals (e.g., Central and Northern Appalachia) command premium prices due to better energy density, while lower-Btu options like Powder River Basin remain the cheapest, often used for large-scale utility generation.
Spot Prices in Dollars per mmBtu
To account for varying heat content, prices are also expressed per mmBtu, providing a standardized measure of energy value. This normalizes comparisons across coal types.
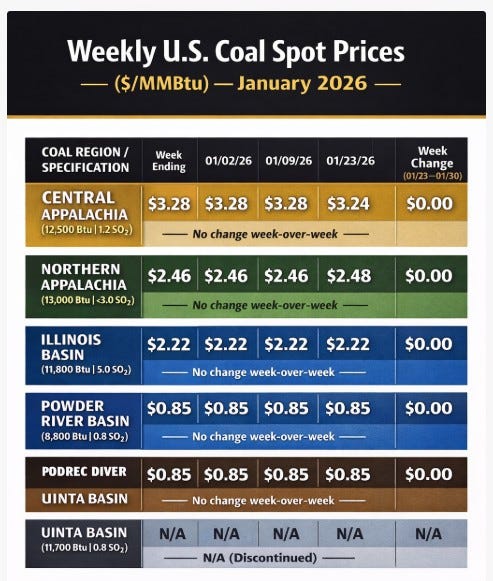
• Trends: Per-mmBtu prices mirror the per-ton stability, with Central Appalachia’s slight decline reflecting its higher heat content adjustment. Powder River Basin remains the most economical on an energy basis at $0.85/mmBtu.
• Why mmBtu Matters: This metric highlights value-for-energy; for example, despite lower per-ton prices, Powder River Basin coal’s subbituminous nature results in a competitive per-mmBtu rate for high-volume users.
Monthly Export Trends
While spot prices focus on domestic markets, export volumes provide context on global demand influences. Based on EIA charts (data through July 2025, with 5-year ranges):
• Coal Exports: Monthly volumes ranged from approximately 8 million to 10 million short tons in late 2024 through mid-2025, showing a slight downward trend from peaks in early 2025. The 5-year range indicates volatility, with lows around 4 million and highs near 12 million short tons.
• Coke Exports: Volumes were lower, fluctuating between 200,000 and 500,000 short tons monthly, with a notable spike in early 2025 followed by a decline. The 5-year range shows similar patterns, with occasional peaks above 600,000 short tons.
These trends suggest stable but not growing export demand, potentially capping upward pressure on domestic prices. Data source: U.S. Department of Commerce, Bureau of the Census.
Market Context and Analysis
• Stability Drivers: January 2026 prices exhibited minimal volatility, likely due to balanced winter demand amid recent cold snaps (as noted in related EIA reports on coal generation surges during storms) and sufficient stockpiles. Policy efforts to extend coal plant operations may support steady pricing by maintaining domestic consumption.
• Comparisons:
• Year-over-Year: Without specific prior-year data in this release, historical notes indicate these prices are within typical ranges, though Central Appalachia remains elevated compared to lower-sulfur alternatives.
• Regional Disparities: Appalachia coals (bituminous, higher Btu) fetch 4–5 times the price of Powder River Basin (subbituminous, low sulfur), reflecting transportation costs, quality, and end-use preferences.
• Influencing Factors: SO2 content affects prices due to emissions regulations; lower-SO2 coals (e.g., Powder River) are favored for compliance. Broader energy market shifts, including natural gas competition and renewables growth, continue to pressure coal prices downward long-term.
• Limitations: These are spot market prices and do not represent all transactions (e.g., long-term contracts). Uinta Basin data discontinuation limits Western region coverage.
Outlook
The next EIA Coal Markets update is scheduled for February 9, 2026. Anticipated factors include ongoing winter weather impacts on demand, potential policy changes under the current administration (e.g., coal plant extensions), and global trade dynamics (e.g., Indonesian export halts affecting seaborne prices). For futures pricing, consult CME Group directly.
This report is based solely on the provided EIA data. For more granular analysis or international comparisons, additional sources may be required. If you need expansions on specific regions or historical trends, let me know.
U.S. Domestic Coal Employment and Wages Estimate: January 2026
Overview
This report provides an estimated snapshot of U.S. domestic coal industry employment and wages for January 2026. Direct employment data is based on the U.S. Bureau of Labor Statistics (BLS) Current Employment Statistics (CES) survey series CES1021210001 (”All employees, thousands, coal mining, seasonally adjusted”).
• The most recent published figure is for December 2025: 40.7 thousand (40,700) direct employees.
• The January 2026 Employment Situation report (which would include January data) was scheduled for release on February 6, 2026, but appears delayed or not yet reflected in public sources as of early February 2026. Some references note a government shutdown impacting October 2025 data collection, with revisions planned.
• No confirmed January 2026 figure is available in current public releases. Recent months show stability with minor fluctuations (e.g., November 2025: 41.1 thousand; October 2025: 40.6 thousand).
• For this January 2026 estimate, we conservatively use the December 2025 level of 40,700 direct jobs as the baseline, assuming limited change amid ongoing industry trends (modest production growth from policy supports but long-term structural decline).
Estimates incorporate the requested methodology:
• Direct Employment: Coal mining workers (NAICS 2121).
• Indirect Employment: Contract and service support workers, using a 3.5 jobs multiplier per direct job.
• Total Employment: Direct + Indirect.
• Wages: Annualized using $93,000 average for direct coal miners and $54,000 average for indirect/support workers (industry benchmarks; excludes benefits, overtime, or regional adjustments).
All figures are rounded to the nearest whole number. This provides a conservative, data-grounded estimate for early 2026.
Employment Estimates (January 2026)
• Direct Employment: 40,700 jobs.
• Indirect Employment: 40,700 × 3.5 = 142,450 jobs.
• Total Employment: 40,700 + 142,450 = 183,150 jobs.
Category | Employment (Jobs) | Percentage of Total
Direct (Coal Mining) | 40,700 | 22.2%
Indirect (Support/Contract) | 142,450 | 77.8%
Total | 183,150 | 100%
Key Employment Insights
• Direct jobs remain near historic lows, down from peaks of over 800,000 in the early 20th century and around 50,000–60,000 in the mid-2010s.
• The 3.5 multiplier captures significant ripple effects in coal-dependent regions (e.g., transportation, equipment services, and local suppliers), particularly in Appalachian and Western states.
• Recent trends indicate slight quarterly stability or minor declines, influenced by winter demand surges (e.g., during storms) offset by plant retirements and renewables growth.
• State-level transitions (e.g., Colorado’s proposed hiring preferences for displaced workers) highlight ongoing workforce challenges.
Wages Estimates (Annualized, January 2026 Baseline)
• Direct Wages: 40,700 jobs × $93,000 = $3,785,100,000.
• Indirect Wages: 142,450 jobs × $54,000 = $7,692,300,000.
• Total Wages: $3,785,100,000 + $7,692,300,000 = $11,477,400,000 (approximately $11.48 billion).
Category | Average Annual Wage | Total Annual Wages
Direct (Coal Mining) | $93,000 | $3,785,100,000
Indirect (Support/Contract) | $54,000 | $7,692,300,000
Total | - | $11,477,400,000
Key Wages Insights
• Direct wages reflect skilled, often hazardous work with higher pay in unionized or Western operations.
• Indirect wages represent a broader mix of roles (e.g., trucking, maintenance, administration), contributing the majority of total payroll due to the multiplier.
• Annual total of ~$11.5 billion underscores coal’s economic role in supporting household incomes, especially in rural areas, despite low direct job counts.
Methodology and Assumptions
• Baseline Data: BLS CES series CES1021210001 (seasonally adjusted, thousands of persons). December 2025 used as proxy for January 2026 due to data lag.
• Multiplier: Applied as specified (3.5× direct) to estimate contract/support jobs; this focuses on immediate supply-chain effects (conservative vs. broader induced multipliers).
• Wage Averages: $93,000 (direct) and $54,000 (indirect) per user instructions; aligned with BLS occupational data for mining roles.
Limitations:
• No official January 2026 data yet; estimate assumes stability from December.
• Excludes induced jobs (e.g., retail from miner spending) or non-mining coal roles (e.g., utility operators).
• Seasonal factors (winter demand) or policy changes (e.g., plant extensions) could cause minor upward revisions.
• Long-term trend: Projections suggest further gradual declines (e.g., some forecasts ~34,900–38,000 direct by late 2026).
U.S. Domestic Coal Employment and Wages Estimate: Breakdown by State (January 2026)
Overview
This report provides an estimated state-level breakdown of U.S. domestic coal industry employment and wages for January 2026, building on the national direct employment baseline of 40,700 jobs (from BLS CES data for December 2025, used as proxy due to data lag). State-level direct employment proportions are derived from the most recent reliable distributions (primarily 2024–2025 data from sources like IndustrySelect, Statista, and EIA-related reports), scaled to the current national total of 40,700 direct jobs.
Key notes:
• Direct employment focuses on coal mining (NAICS 2121) workers.
• Indirect employment uses the specified 3.5 multiplier per direct job (contractors, support, services).
• Wages: $93,000 average annual for direct miners; $54,000 for indirect/support workers.
• Top states account for the vast majority of jobs, concentrated in the Appalachian (underground) and Western (surface) regions.
• Data reflects approximate shares from late 2024/early 2025 reports, adjusted proportionally to the 40,700 national figure. Minor states (e.g., <1% share) are grouped as “Other.”
• Total national figures remain: Direct: 40,700; Indirect: 142,450; Total: 183,150; Total Wages: ~$11.48 billion.
State-Level Breakdown
The table below shows estimated direct jobs by state, indirect (multiplied), total employment, and annualized total wages (direct + indirect).
*Other states include Colorado, Illinois, Montana, North Dakota, Utah, and smaller producers (e.g., Maryland, Oklahoma). These collectively represent residual shares.
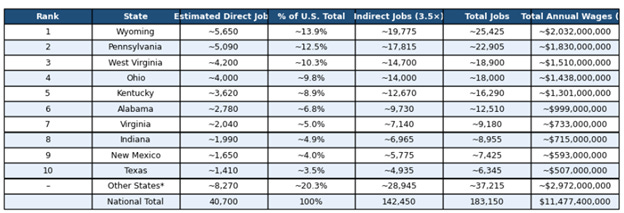
Key Insights by Major States/Regions
• Wyoming (Western region, primarily surface mining in Powder River Basin): Leads due to large-scale, efficient operations. High productivity means fewer workers per ton produced, but still significant total employment.
• Pennsylvania (Appalachian, mix of bituminous and anthracite): Strong in underground and surface; includes both bituminous and anthracite segments.
• West Virginia (Appalachian core): Highest concentration of underground mining; historically the “coal capital” with deep economic ties.
• Appalachian Cluster (WV, PA, KY, OH, VA, AL): Accounts for ~50–55% of direct jobs, focused on higher-Btu bituminous coal.
• Western Cluster (WY, NM, TX, UT, MT, ND): ~30–35% share, dominated by low-cost subbituminous/lignite from large surface mines.
• Interior Region (IL, IN, TX): Smaller but stable, often surface operations.
Wages Breakdown Insights
• Total wages are heavily weighted toward indirect roles (due to the 3.5 multiplier), emphasizing supply-chain and support impacts.
• Higher direct wages ($93k) in states like Wyoming and West Virginia reflect skilled labor and union influences.
• Economic footprint is outsized in rural coal counties, where mining supports local retail, services, and taxes.
Methodology and Caveats
• Proportions: Scaled from 2024–2025 distributions (e.g., IndustrySelect top-10 states ~79.7% of total; adjusted to 40,700 national direct jobs). Minor shifts possible due to production changes.
• Data Sources: BLS national (December 2025: 40.7k); state shares from industry reports (e.g., 2023–2025 Statista/IndustrySelect/EIA-aligned data).
• Limitations: State-level BLS CES data is not publicly broken out monthly for coal mining (national only); estimates use proportional scaling. MSHA provides quarterly operator/contractor data but not always state-specific in real-time public views. Actual January 2026 figures may vary slightly upon BLS release (delayed to ~February 11, 2026).
• Trends: Employment remains stable-to-declining long-term; policy supports (e.g., plant extensions) may slow losses in key states.
This breakdown highlights coal’s concentrated regional impact. If you’d like refinements (e.g., focus on specific states, production correlation, or updates post-new BLS data), let me know.
Outlook
The next BLS Employment Situation release (potentially delayed) is expected to provide the official January 2026 figure. If it shows change (e.g., due to storm-related hiring or retirements), estimates can be updated. Coal’s employment footprint remains amplified by indirect effects, supporting policy debates on extensions vs. transitions.
Electricity Demand, Production and Margin
The most recent comprehensive weekly U.S. electricity data from the EIA is available through the Hourly Electric Grid Monitor (real-time dashboard), which provides daily and weekly aggregates for generation mix, though it does not publish a dedicated “weekly fuel mix report” like the coal production one. The latest available snapshot aligns with early February 2026 data (e.g., daily generation mix as of February 3, 2026, Eastern Time, covering recent weeks including the week ended ~January 31/February 1 during/after Winter Storm Fern impacts).
EIA does not release a formal weekly electric production/demand/margin report equivalent to the coal weekly overview. Instead:
• Generation by fuel type is tracked daily/weekly via the Grid Monitor dashboard.
• Demand (load) is monitored hourly/daily, with weekly summaries derivable.
• Operational margin (reserve margins or operating reserves) varies by region (e.g., PJM, MISO) and is not nationally aggregated weekly by EIA; it’s often reported by ISOs/RTOs during events like storms, with national estimates indirect via total capacity vs. peak load.
Key recent insights (focusing on the week ended January 25/31, 2026, impacted by Winter Storm Fern, and extending to early February data):
• Coal-fired generation surged 31% week-over-week in the Lower 48 states during the week ending January 25, 2026, to meet elevated demand from cold weather.
• Coal accounted for ~21% of generation that week (up from 17% prior), with natural gas also rising 14%, while renewables (solar, wind, hydro) declined due to weather.
• Overall U.S. daily generation examples from early February 2026 (e.g., February 3 aggregate across regions) show natural gas dominant (~38%), coal ~20%, nuclear ~18%, wind ~11%, solar/hydro ~5–10% each, with minor petroleum/other.
U.S. Electric Production, Demand, and Margin Overview
Data Period Focus: Week ended ~January 31, 2026 (aligned with coal report timing), with context from Winter Storm Fern (peak impacts January 24–26, 2026) and early February snapshots.
Source: U.S. Energy Information Administration (EIA) Hourly Electric Grid Monitor, Today in Energy analyses (January 28–February 2026 releases), and related reports. No single “weekly bulletin” exists for electricity like coal; data is dashboard-based and event-driven.
Key Highlights
• Total U.S. Electricity Generation (Lower 48 States, Approximate Weekly Context): During cold weather weeks like late January 2026, generation rose to meet surging demand, with coal providing much of the incremental output. Annual 2025 generation was ~4,260 billion kWh; forecasts show modest growth (1.1% in 2026).
• Demand Trends: Winter peaks drove record or near-record loads in regions (e.g., PJM forecasted/approached 148 GW peaks in late January/early February). National demand spiked due to heating needs, with operational challenges in constrained areas (e.g., transmission limits in PJM).
• Operational Margin/Reserve Insights: Margins tightened during storms (e.g., high-voltage line restrictions averaged ~13 hours in PJM on peak days; some areas saw elevated blackout risks from congestion). Nationally, no widespread outages reported, but reserves were stressed in affected regions (ERCOT, MISO, SPP, PJM, ISO-NE, NYISO). Coal’s quick ramp-up helped maintain reliability.
Estimated Fuel Mix (Based on Recent Weekly Patterns, Lower 48 States)
From EIA Grid Monitor and Today in Energy (week ending January 25, 2026, and similar cold periods):
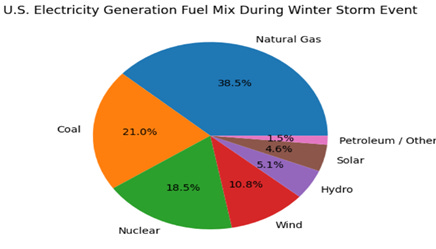
• Natural Gas: ~35–40% (increased 14% week-over-week during storm; dominant baseload/flexible source).
• Coal: ~20–21% (up 31% week-over-week; key for meeting demand spikes, reversing milder January trends).
• Nuclear: ~18% (stable, near full output).
• Wind: ~10–11% (declined during storm due to weather/icing).
• Hydro: ~5% (lower during cold snaps).
• Solar: ~4–5% (seasonally lower in winter).
• Petroleum/Other: ~1–2% (higher in regions like New England, where petroleum surpassed natural gas briefly during peak storm hours).
(Note: Exact weekly MWh totals vary; e.g., sample daily aggregates in early February showed ~12 million MWh/day nationally, with breakdowns as above. For precise current daily/weekly, refer to EIA’s dashboard.)
Demand and Margin Notes
• Peak Demand Example: During storm peaks, regional loads hit extremes (e.g., PJM near/all-time winter records ~148 GW). National weekly demand not centrally aggregated but inferred higher than average winter levels.
• Operational Margin:
• Reserves strained but sufficient; coal ramp-up prevented shortfalls.
• In New England, petroleum-fired units provided critical support (up to ~8 GW peak, exceeding dedicated capacity via fuel-switching).
• Broader forecasts indicate tightening margins long-term due to rising demand (data centers, electrification) vs. retirements, but short-term winter events managed via dispatchable fuels.
This section complements the coal production report by highlighting coal’s role in electricity during high-demand periods. For real-time or more granular data, visit EIA’s Hourly Electric Grid Monitor.
U.S. Steel Industry: Demand, Production, and Employment Overview
Data Period Focus: Week ending January 31, 2026 (aligned with the latest available American Iron and Steel Institute (AISI) weekly raw steel production report, released early February 2026). This covers the most recent weekly data as of February 7, 2026.
Primary Sources: American Iron and Steel Institute (AISI) weekly raw steel production reports; supplemental industry analyses from Steel Market Update, SteelOrbis, ScrapMonster, and related publications.
Note: Weekly demand metrics are not directly published (demand is inferred via production trends, shipments, and capacity utilization); employment data is annual/monthly from sources like IBISWorld and BLS-derived figures.
Executive Summary
U.S. raw steel production for the week ending January 31, 2026, totaled 1,758,000 net tons, down 1.1% from the prior week’s 1,778,000 net tons but up 3.4% from 1,700,000 net tons in the same week of 2025. Capacity utilization stood at 76.0%, a slight dip from 76.9% the previous week and 76.3% year-ago. This reflects steady underlying demand despite a minor weekly pullback, supported by industrial activity, infrastructure, and protective trade measures.
Year-to-date (through January 31, 2026) production reached 7,774,000 net tons, up 3.4% from 7,518,000 net tons in the comparable 2025 period, with average utilization at 76.0%.
Demand indicators point to modest growth, with full-year 2025 shipments up 4.9% and forecasts suggesting ~1.8% demand increase in 2026 driven by manufacturing, energy projects, and reshoring. Employment in iron and steel manufacturing remains stable to slightly up, at approximately 72,386 workers as of early 2026 estimates.
Weekly Raw Steel Production
• Total U.S. Production: 1,758,000 net tons (down 20,000 net tons or 1.1% week-over-week).
• Capacity Utilization Rate: 76.0% (down from 76.9% prior week).
• Comparison to Prior Week (ended January 24, 2026): Down 1.1%.
• Comparison to Same Week Last Year (ended January 31, 2025): Up 3.4% (from 1,700,000 net tons).
Regional Breakdown (thousands of net tons):
• Northeast: 119
• Great Lakes: 518
• Midwest: 257
• South: 799 (leading region)
• West: 65
Notes: Production remains above the YTD weekly average (1,750,000 net tons) and shows resilience amid seasonal factors and economic conditions.
Demand Indicators
Weekly demand is not tracked directly but inferred from production, capacity utilization, shipments, and market signals:
• Production as Demand Proxy: The 3.4% year-over-year increase signals sustained demand, particularly in construction, automotive, and energy sectors.
• Recent Monthly Context: December 2025 steel shipments totaled 7,454,338 short tons (up 5.4% month-over-month and 3.5% year-over-year); full-year 2025 shipments rose 4.9% to 90,953,066 short tons.
• Outlook: Industry forecasts indicate ~1.8% demand growth in 2026, supported by reshoring, infrastructure investments, EV/manufacturing expansion, data centers, and renewable energy projects. Protective tariffs continue to bolster domestic demand by limiting imports.
• Market Signals: Hot-rolled coil (HRC) lead times extended to ~6.4 weeks by late January 2026, indicating tighter supply relative to demand in key segments.
Employment in the Steel Industry
Employment data is reported monthly/annual rather than weekly, with the latest available figures showing stability and slight recovery:
• Iron & Steel Manufacturing Employment (2026 estimate): Approximately 72,386 workers (as of January 1, 2026, per IBISWorld industry analysis).
• Recent Trends: Slight increase from 71,531 in 2025; however, longer-term five-year average shows a -2.3% decline (2021–2026), reflecting automation, efficiency gains, and prior cyclical downturns.
• Broader Context: Primary metals sectors saw output surges in late 2025/early 2026, offsetting some manufacturing weakness. Tariffs and domestic expansions are driving targeted hiring in skilled roles (e.g., metallurgists, technicians), though overall manufacturing employment faced headwinds in 2025 (e.g., -68,000 jobs sector-wide).
• NAICS 3311 (Iron and Steel Mills and Ferroalloy Production): Historical BLS-derived data shows employment around 85,000–86,000 in recent years (e.g., 85.7 thousand in 2024), with ongoing monitoring for 2026 updates.
This section integrates with prior reports (e.g., coal production) by illustrating steel’s role in industrial demand chains, where coal/coke supports blast furnace operations. Production stability amid modest demand growth highlights resilience in a protected market. For real-time updates, refer to AISI Industry Data. If regional breakdowns, forecasts, or visuals are needed, let me know.
Weekly Rail and Barge Report
Data Period Focus: Week ending January 31, 2026 (Week 4 of 2026, aligned with the latest AAR rail traffic release on February 4, 2026, and contextual barge data from early February 2026 sources).
Release Context: Current date February 7, 2026.
This report draws from the Association of American Railroads (AAR) weekly rail traffic summary and U.S. Army Corps of Engineers (USACE) inland waterway updates, reflecting impacts from severe winter weather (e.g., Winter Storm Fern and deep freezes affecting Midwest/East rail operations and Illinois River ice impediments).
Executive Summary
U.S. rail traffic for the week ending January 31, 2026, totaled 434,361 carloads and intermodal units, down 15.5% year-over-year (YoY), driven by severe weather disruptions in the Midwest and East that slowed operations, reduced volumes across most commodities, and contrasted with the prior week’s gains. Carloads alone fell to 191,188 (-14.0% YoY), while intermodal was 243,173 containers/trailers (-16.6% YoY). Coal rail loadings specifically dropped sharply to 50,189 cars (-9,888 from same week 2025), aligning with the EIA coal production decline of ~15% week-over-week noted in prior reports.
Barge traffic faced significant winter constraints, particularly on the Illinois River system due to ice, with reports of stuck barges, lock slowdowns/cautions, and reduced movements (e.g., USACE noted significant ice impacts at four Illinois River locks as of February 4, 2026). Grain barge data from late January (week ending January 17) showed 446,867 tons moved (-15% week-over-week, +4% YoY), but early February conditions suggest further slowdowns amid the freeze.
Year-to-date (first four weeks of 2026): U.S. rail carloads 863,558 (+4.4% YoY); intermodal 1,068,353 (-3.5% YoY); combined traffic 1,931,911 (-0.1% YoY). North American rail (including Canada/Mexico) showed similar weather-impacted declines.
These modes remain critical for coal, grain, chemicals, and other bulk shipments, with rail supporting coal transport (as seen in the 50,189 coal cars loaded) and barges handling grain/export flows.
Rail Traffic Overview (AAR Data, Week Ending January 31, 2026)
• Total U.S. Rail Traffic: 434,361 carloads + intermodal units (-15.5% YoY).
• Total Carloads: 191,188 (-14.0% YoY; down from 218,784 prior week and 224,783 two weeks prior).
• Intermodal Volume: 243,173 containers/trailers (-16.6% YoY).
Key Commodity Highlights (Selected, vs. Same Week 2025):
• Grain: +637 carloads to 22,655 (only group with increase).
• Coal: -9,888 carloads to 50,189 (sharp decline, consistent with lower coal production and weather-related rail slowdowns).
• Nonmetallic Minerals: -7,948 carloads to 18,702.
• Motor Vehicles & Parts: -4,374 carloads to 11,311.
• Other groups (e.g., chemicals, farm products) generally declined amid weather.
Regional/Operational Notes:
• Severe weather caused significant disruptions in Midwest/East, contributing to the steep drop after the prior week’s rally.
Year-to-Date (First 4 Weeks 2026):
• Carloads +4.4%; intermodal -3.5%; combined -0.1%.
Barge Traffic Overview (Inland Waterways, Early February 2026 Context)
Movements are tracked via USACE Lock Performance Monitoring System (LPMS) and Inland Waterway reports, with grain as a primary focus (often weekly totals in thousands of tons). No exact weekly tonnage for the precise January 31 week is available in public releases (latest detailed USDA Grain Transportation Report covers up to mid/late January), but conditions indicate winter slowdowns.
Recent Grain Barge Movements (Week Ending January 17, 2026 – Latest Detailed USDA Snapshot):
• Total barged grain: 446,867 tons (-15% from prior week; +4% YoY).
• Downriver grain barges: 314 (-15 from prior week).
• Grain barges unloaded in New Orleans region: 985 (-19% from prior week, but contextually variable).
Current Conditions (as of February 4–6, 2026):
• Deep freeze and ice significantly impeded traffic on the Illinois River system (key for Midwest grain/coal-related moves).
• USACE reports: Significant ice impacts at four locks on Illinois River, with barges stuck, movement stoppages/slowdowns, and caution notices ongoing for weeks.
• Broader Mississippi/Ohio/Arkansas systems likely affected by cold weather, though less dramatically than rail in some areas.
Broader Trends:
• Grain barge tonnages typically peak in harvest/post-harvest; winter ice/freeze adds constraints, increasing costs and delays for commodities like corn, soybeans, and wheat. Export staging via Gulf remains active but slower.
Key Insights and Connections
• Weather Impact: The week’s rail declines and barge impediments stem from widespread cold weather and storms, reducing operational efficiency and volumes—particularly for weather-sensitive bulk like coal (rail) and grain (barge).
• Link to Prior Reports: Coal rail loadings (50,189 cars) reflect the EIA-reported ~15% drop in weekly coal production (8,885 thousand short tons), highlighting rail’s role in coal transport amid lower output and demand pressures.
• Outlook: Expect potential recovery in coming weeks as weather moderates, though seasonal winter factors persist. Rail YTD gains in carloads suggest underlying resilience; barge recovery depends on thaw/ice clearance.
This report can be incorporated into broader industrial/energy currents (e.g., alongside coal, steel, electricity sections). Sources: AAR (February 4, 2026 release), USACE Inland Waterway reports, USDA Grain Transportation insights. For real-time updates, check AAR Rail Traffic or USACE LPMS. If regional details, charts, or next-week previews are needed, let me know.
The Weekly SWOT: U.S. Coal Industry Outlook
Week of February 8–14, 2026
Overview
This SWOT analysis provides a forward-looking snapshot of the U.S. domestic coal industry for the week of February 8–14, 2026, based on recent market trends, policy developments, and production forecasts.
The industry continues to benefit from short-term government interventions tied to winter reliability concerns, but faces persistent structural headwinds from renewable generation growth, regulatory pressure, and long-term economic shifts.
Key current influences include:
Stable January spot prices
Modest 2025 production growth (up 3.4% to approximately 530 million short tons)
Forecasted production declines in 2026 driven by retirements and evolving generation mixes
This analysis incorporates ongoing grid-reliability debates following Winter Storm Fern, regulatory extensions under emergency authorities, and global market signals, with attention to upcoming EIA updates (including the Short-Term Energy Outlook) and potential federal policy announcements.
Strengths
· Policy Support and Grid Reliability
Emergency orders issued under Section 202(c) of the Federal Power Act have extended operations at aging coal plants, reinforcing coal’s role during recent cold-weather events. During peak demand, coal supplied roughly 24% of generation, helping avert blackouts and underscoring its value as dependable baseload capacity.
Additional near-term advantages include:
Reduced federal coal royalties (down to 7%)
Targeted tax credits supporting metallurgical coal production
Together, these measures improve short-term financial viability and operational continuity.
· Stable Pricing and Production Resilience
January spot prices remained largely flat, with Central Appalachian coal averaging approximately $81 per ton. Firm natural gas prices continued to support coal dispatch. Production gains in 2025 were driven by delayed retirements and steady export demand, providing modest momentum entering early 2026.
· Export Market Footing
U.S. coal exports strengthened in late 2025. Continued upside is possible if disruptions in Asian supply—particularly Indonesian production cuts—tighten global markets. U.S. metallurgical coal remains well positioned to serve steelmaking demand abroad.
Weaknesses
· Declining Output and Capacity
Despite short-term support, coal production is projected to decline in 2026 as utilities accelerate fuel transitions. Coal-fired generation is expected to fall approximately 9%, with roughly 6 GW of retirements scheduled, increasing underutilization and contributing to higher stockpiles.
· High Operational Costs and Industry Pushback
Emergency plant extensions have increased system costs, with estimates ranging from $3 billion to $6 billion in added consumer expenses due to maintenance inefficiencies and aging infrastructure. Several utilities have resisted continued operation mandates, citing economic unviability and regulatory risk.
· Workforce and Regional Vulnerabilities
Coal employment remains historically low, at roughly 40,700 direct jobs nationwide. Long-term declines in coal-dependent regions limit workforce flexibility, even where state-level transition programs—such as hiring preferences—are in place.
Opportunities
· Natural Gas Price Support
Although long-term natural gas forecasts have been revised lower, prices remain firm through at least 2027. LNG export growth continues to tighten domestic supply, allowing coal to regain generation share in certain regions. Coal’s share of generation increased approximately 7% in 2025, particularly in the South and Northeast.
· Deregulatory Momentum
Pending regulatory delays—such as extensions on coal ash cleanup compliance into the 2031–2032 timeframe—could reduce near-term compliance burdens. Proposed mining expansion legislation may reopen access to federal lands, supporting investment in coal-adjacent projects under emerging “Coal Day 2.0” policy efforts.
· Global Demand Shifts
Disruptions in seaborne coal trade and ongoing infrastructure expansion in Asia present export opportunities. U.S. producers may stabilize domestic conditions by filling supply gaps abroad, particularly in metallurgical markets.
Threats
· Accelerated Renewable Deployment
Solar and wind generation continue to expand rapidly. China’s solar capacity is projected to overtake coal generation in 2026, serving as a cautionary global model. In the U.S., coal’s generation share—currently around 18.7%—is projected to decline sharply, potentially falling by half by 2035 as renewable costs drop and Midwest installations expand.
· Legal and Regulatory Challenges
Recent judicial rulings limiting state-level anti-ESG measures, along with lawsuits challenging federal emergency authorities, may constrain future coal plant extensions. Environmental litigation targeting coal ash and water regulations presents additional operational risk.
· Market Volatility and Competition
Global oversupply, warmer-than-average weather forecasts, and increasing competition from natural gas and renewables could suppress coal demand. U.S. coal consumption is forecast to decline by roughly 10% in 2026 as retirements accelerate and alternative generation fills the gap.
OP-ED: The Elephant in the Room: Winter Keeps Exposing the Cost of a Decade of Bad Energy Policy
Every winter has a way of stripping away illusions.
When temperatures plunge and demand surges, ideology gives way to physics. Steel does not care about slogans. Power plants do not respond to speeches. The grid either works—or it doesn’t.
This week’s elephant in the room is not a failure of leadership today, but the lingering consequences of a decade of energy policy that deliberately pushed dependable baseload power to the margins. Winter Storm Fern once again reminded us that we are living with decisions made long before this administration took office—and that repairing the damage will take time we may not have.
The truth is unavoidable: the electric grid survived this winter because dispatchable energy—especially coal—was still there to answer the call, even after years of being sidelined by policy choices under Presidents Obama and Biden.
As Winter Storm Fern swept across the country in late January, electricity demand surged toward record levels. PJM approached 148 gigawatts of load. Reserve margins tightened. Transmission congestion flared. In New England, oil-fired units—units policymakers insisted were obsolete—were pressed back into service.
Coal-fired generation surged more than 30 percent week over week. Coal’s share of national generation jumped from roughly 17 percent to around 21 percent, overtaking weather-dependent renewables that faltered under ice, snow, and still air. Natural gas output also increased sharply, but pipeline constraints and regional limitations once again proved that gas alone cannot shoulder the entire burden during extreme conditions.
The lights stayed on. Homes stayed warm. Industry kept running.
That outcome was not accidental. It was the result of dispatchable power plants—plants that can run on demand—absorbing the shock when the system was stressed.
And yet, even as coal was stabilizing the grid, coal production itself was falling.
Weekly coal output dropped 15 percent from the prior week and more than 18 percent from a year earlier. Wyoming and West Virginia posted double-digit declines. Rail loadings fell sharply. Barge traffic slowed as ice choked key waterways. These are not isolated data points. They are symptoms of a system that has been steadily weakened by years of regulatory pressure and premature retirements.
That is the contradiction we are now living with: we rely on coal to keep the grid stable, while the supply chain that supports it has been systematically eroded.
It did not happen overnight. And it did not happen under the current administration.
For more than a decade, federal policy actively favored intermittent generation while treating baseload fuels as something to be phased out as quickly as possible. Plants were retired not because they were unreliable, but because policy made them uneconomic. Investment dried up. Workforce pipelines narrowed. Infrastructure aged without replacement.
President Trump inherited that reality.
To his credit, this administration has moved quickly to stop the bleeding—using emergency authorities to keep critical plants running, easing regulatory burdens, and restoring a focus on reliability and energy security. Those steps matter. They are necessary. And they are already making a difference.
But energy systems are not rebuilt on a political calendar.
Righting the ship takes time—time to stabilize supply chains, time to rebuild skilled workforces, time to invest in maintenance and modernization. And time, unfortunately, is the one thing the grid does not grant us during extreme weather.
The broader industrial picture reinforces the point.
Steel production remains resilient, up more than 3 percent year over year, supported by manufacturing demand and trade protections. Capacity utilization remains healthy. Steel jobs are holding steady. That strength exists because heavy industry depends on reliable power, not promises.
Transportation, by contrast, buckled under winter stress. Rail traffic dropped more than 15 percent year over year. Coal cars declined by nearly 10,000 in a single week. Barges slowed or stopped as ice locked rivers. These disruptions expose how thin the margin for error has become across the physical economy.
This is not a warning about the future. It is a description of the present.
Dispatchable energy—coal, natural gas, nuclear, and even oil in emergencies—remains the foundation of grid reliability. That is not a political statement. It is an operational fact confirmed every time temperatures plunge.
The real elephant in the room is this: we are trying to rebuild reliability at the same time we are testing its limits. The policies that weakened the grid took years to implement. Undoing them will take years as well. Until that work is finished, the system remains vulnerable.
Winter Storm Fern did not break the grid—but it reminded us how close we are to the edge.
The question now is whether we acknowledge that reality honestly, learn from it quickly, and give reliability the priority it deserves—before the weather decides to teach the lesson again, more harshly next time.
About the Author
Terry L. Headley, MBA, MA, is a veteran energy communicator, strategist, and researcher with more than 25 years of experience at the intersection of energy policy, industrial economics, and public affairs. A former journalist, he has served as a communications director and senior advisor for major energy and coal industry organizations, where he helped shape national and state-level debates over grid reliability, fuel diversity, and energy security.
Headley is widely recognized for developing data-driven messaging strategies that translate complex energy and industrial issues into plain language for policymakers, media, and the public. He is the author of multiple books and long-form studies on energy policy, public relations strategy, and the political economy of America’s industrial base. His work focuses on reliability, affordability, and the often-overlooked role of dispatchable energy in supporting modern society.
About The Hedley Company
The Hedley Company is a strategic communications, research, and advisory firm specializing in energy, industrial policy, and infrastructure issues. The firm provides clients with rigorous analysis, message development, media strategy, and thought leadership focused on grid reliability, fuel diversity, critical minerals, and the economic foundations of American industry.
With deep roots in the energy sector, The Hedley Company works with trade associations, policymakers, industry leaders, and advocacy organizations to ensure complex technical issues are communicated clearly, credibly, and effectively. Its work emphasizes facts over ideology and operational reality over theory, helping decision-makers navigate high-stakes policy environments.
About The Seneca Center for Energy and Critical Minerals Policy
The Seneca Center for Energy and Critical Minerals Policy is a research and policy organization dedicated to advancing serious, fact-based discussion on America’s energy security, electric grid reliability, and critical minerals supply chains. The Center focuses on the strategic importance of traditional and emerging energy resources in supporting national security, economic stability, and industrial competitiveness.
Through original research, policy analysis, and public education, the Seneca Center examines the real-world consequences of energy and environmental policy decisions, with particular attention to dispatchable power, supply chain resilience, and the risks of over-reliance on intermittent resources. Its mission is to bring realism, rigor, and historical perspective back into energy policy debates.
Contact Information
Terry L. Headley, MBA, MA
President, The Hedley Company
📧 Email: [email protected]
📞 Phone: 681-279-0484