


A PUBLICATION OF THE HEDLEY COMPANY: WEEK ENDING MARCH 29, 2026 | VOL. 2026, NO. 13 | PUBLISHER: T.L. HEADLEY, MBA
Mar 29, 2026
∙ Paid
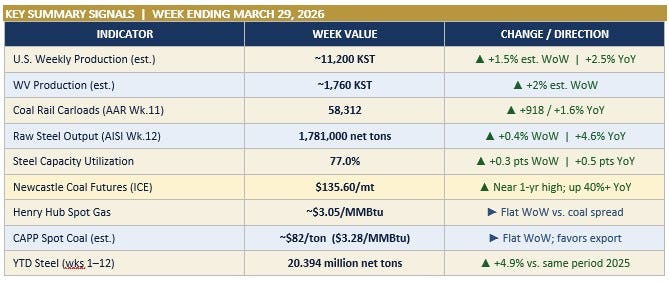
KEY SUMMARY SIGNALS | Week Ending March 29, 2026
EXECUTIVE SUMMARY
CHARLESTON, W.Va. — The week ending March 29, 2026, hands the American coal industry a picture that is simultaneously encouraging and complicated.
Production remains solid, holding in the 11,100–11,200 KST range for the fourth consecutive week after February’s multi-year high of 11,292 KST. Rail is moving: coal carloads for the week ended March 21 came in at 58,312 — up 1.6% year-over-year on AAR data released March 25. That is a genuine YoY gain in a week that compared against a strong 2025 spring. Steel remains a bright spot, with U.S. mills logging 1,781,000 net tons for the week ended March 21, up 4.6% year-over-year and within shouting distance of February’s four-year high.
The global thermal market is the most consequential story running. Newcastle futures closed at $135.60/mt on March 27 — up more than 40% year-over-year and near the top of the 52-week range. The driver is structural, not seasonal: QatarEnergy’s force majeure on Ras Laffan LNG output following Iranian missile strikes has removed roughly 20% of world LNG supply from the market. European TTF gas prices remain well above pre-disruption levels. Every ton of thermal coal that can be contracted and moved to a European or Asian buyer right now is moving at a significant premium above where the seaborne market sat six months ago.
Domestically, the Section 202(c) front remained active this week. The U.S. Department of Energy renewed emergency orders for Indiana’s R.M. Schahfer and F.B. Culley stations through at least June 21 — extending their operational mandate under the Federal Power Act. The order came over loud objections from utilities about rising maintenance costs, with NIPSCO’s president publicly warning of significant capital expenditure required to keep aging equipment running. Utilities are right that these plants cost money. They are also right that the grid is real and that the data center buildout is not imaginary.
The EIA March STEO forecast remains the baseline: ~510–520 MMst U.S. production in 2026, coal generation declining 7% as 4% of capacity retires, met coal exports up 7% led by Warrior Met’s Blue Creek ramp. The Hormuz variable is the wildcard that could push thermal export volumes meaningfully above the 44 MMst baseline. That window remains open. How much of it the U.S. industry captures depends on logistics, contracts, and rail throughput — not on whether the demand is real.
All production estimates for the week ended March 22 are analyst estimates pending the EIA weekly report release Thursday, March 26. State-level data based on allocation methodology per EIA’s published approach. Source citations for each section below.
SECTION 1 — U.S. COAL PRODUCTION
Source: EIA Weekly Coal Production Report (DOE/EIA-0218/5), released March 26, 2026 (est., week ended March 22, 2026). Prior confirmed data: release March 20, week ended March 15. All KST = thousand short tons.
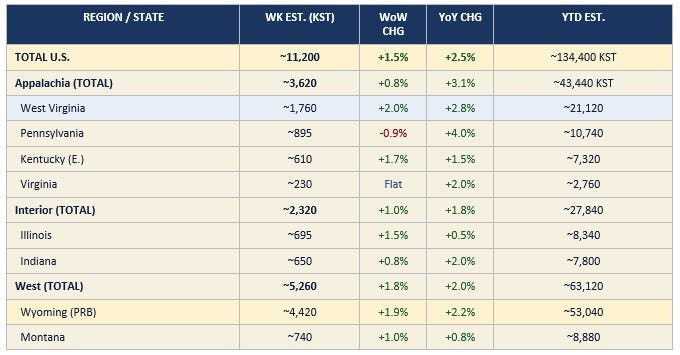
YTD Production (est., Wks 1–12): ~134,400 KST | Tracking ~+3% vs. 2025 pace | 52-wk trailing total est.: ~572,000–580,000 KST
EIA March 2026 STEO Full-Year Forecast: ~510–520 MMst | 2025 Actual: ~502 MMst | Source: EIA STEO, March 10, 2026
SECTION 2 — U.S. COAL SPOT PRICES & ENERGY MARKETS
Sources: EIA Coal Markets Report (est. March 23, 2026); Henry Hub via FRED/EIA (March 27, 2026); NYMEX April NG via Barchart/Farmbucks (March 28, 2026); Newcastle ICE via MacroMicro/Investing.com (March 27, 2026). $/MMBtu conversions: CAPP 12,500 Btu/lb; NAPP 13,000 Btu/lb; ILB 11,800 Btu/lb; PRB 8,800 Btu/lb.
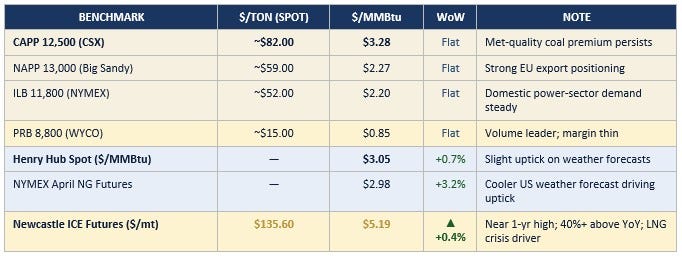
Near 1-yr high; 40%+ above YoY; LNG crisis driver
CAPP–Gas Spread: CAPP at $3.28/MMBtu vs. Henry Hub at $3.05/MMBtu — coal carries a modest premium on a heat-equivalent basis, but CAPP’s low-sulfur, high-energy product commands prices that the EU market will absorb. PRB at $0.85/MMBtu remains far below gas, confirming domestic utility economics strongly favor PRB for power generation wherever infrastructure allows. Newcastle at $135.60 represents a 41.5% increase from the $95.85 close recorded March 29, 2025 — a market signal that the Hormuz disruption has structural legs, not just spot-market noise.
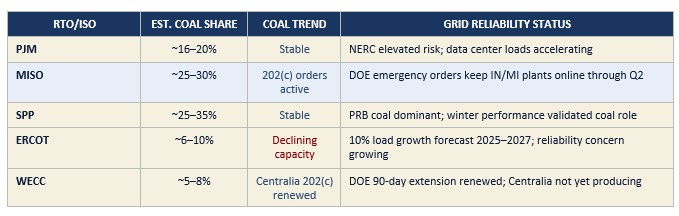
SECTION 3 — ELECTRICITY GENERATION, DEMAND & GRID UPDATE
Sources: EIA Hourly Electric Grid Monitor (continuous, week of March 22–28, 2026); EIA STEO March 2026 (released March 10); NERC LTRA January 2026. Note: Weekly fuel mix figures below are analyst estimates — EIA does not publish verified weekly RTO-level fuel mix data.
Total U.S. electricity demand for the week of March 22–28 is tracking in the 82–86 TWh range, consistent with the early-spring pattern of declining heating demand and stable commercial/industrial load. Year-over-year demand growth remains above 2% nationally, underpinned by data center loads (ERCOT forecasting 7.3% generation growth in 2026), manufacturing expansion, and the ongoing EV charging buildout.
EIA March 2026 STEO — Coal & Grid Key Figures:
• 2026 U.S. electricity generation projected at 4,326 BkWh — up 1.2% vs. 2025 (4,275 BkWh)
• Coal generation forecast: decline of 50 BkWh (7%) in 2026 — most concentrated in Midwest and Southeast
• Gas generation flat to slight increase (+0.5%); higher gas prices support coal-gas switching margin
• Renewables up — but intermittency gap creates demand for dispatchable baseload
• NERC LTRA (January 2026): 13 of 23 North American reliability assessment areas at elevated or high risk — largest reliability deficit on record for a January assessment
RTO/ISO
SECTION 4 — U.S. STEEL PRODUCTION & DEMAND
Source: American Iron and Steel Institute (AISI) Weekly Raw Steel Production, released March 24, 2026, for week ended March 21, 2026. Regional breakdown by AISI district (thousands of net tons).
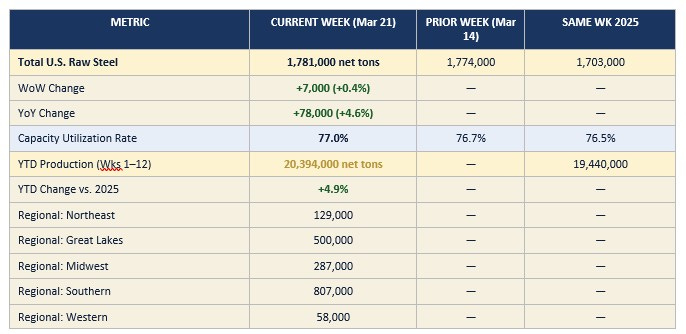
Steel production bounced back this week after three consecutive weeks of decline following February’s four-year high of 1,817,000 net tons. The YTD figure of 20.394 million net tons — running 4.9% above the same period last year — signals a genuine upturn in U.S. manufacturing and construction demand. Southern district leads at 807,000 net tons, reflecting capacity expansion in the Southeast. For the met coal market, this performance matters: robust domestic steel output means Blue Creek, Leer South, and Longview production has real domestic buyers alongside the export opportunities.
Note: AISI reports are estimated weekly figures compiled from ~50% of domestic production capacity. Monthly AIS-7 report (subscription) provides definitive data.
SECTION 5 — COAL EMPLOYMENT & ECONOMIC IMPACT
Sources: EIA Annual Coal Report 2024 (released November 19, 2025): 44,060 direct employees, 524 producing mines. BLS Current Employment Statistics, Series CES1021210001 (coal mining). Multiplier: 3.5x per IBISWorld benchmarks. WV-specific data: Seneca Center for Energy and Critical Mineral Research analysis of WVU BBER data (2025).
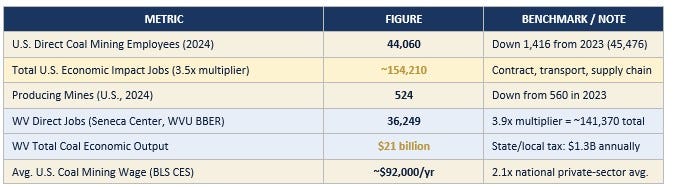
Every 100 direct coal mining jobs lost translates to approximately 350 total jobs lost across the broader regional economy — transportation, equipment service, food service, healthcare, education. In southern West Virginia, the Logan–McDowell–Mingo corridor, that arithmetic is not abstract. It is visible in empty storefronts and school enrollment declines. The employment data above is not a feel-good statistic. It is the economic argument for why coal policy decisions made in Washington have consequences that land in places Washington rarely visits.
SECTION 6 — RAIL TRAFFIC & TRANSPORTATION
Sources: Association of American Railroads (AAR) Weekly Railroad Traffic Report, released March 25, 2026, for week ended March 21, 2026 (Week 11). Prior week (Week 10, ended March 14): released March 19, 2026. AAR reporting includes U.S. Class I railroads.
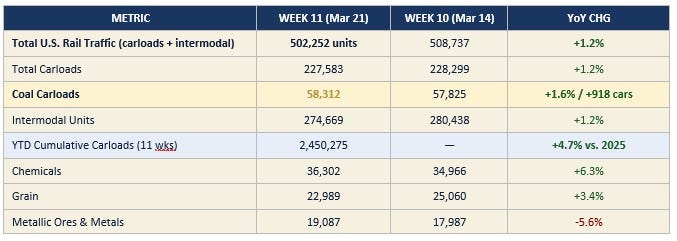
The Week 11 coal carload figure of 58,312 — up 1.6% year-over-year — reverses the soft Week 10 YoY comparison (-5.9%) and confirms the underlying coal rail trend remains healthy. The Week 10 decline was a base-effect comparison against a strong spring 2025 week; Week 11 clears that hurdle cleanly. The three-week coal carload sequence — 62,480 (Week 9) → 57,825 (Week 10) → 58,312 (Week 11) — is consistent with normal post-winter moderation after February’s surge. Barge operations on the inland river system remain fully operational following January flood disruptions; Gulf Coast export terminal throughput is steady. Cumulative YTD carloads running 4.7% ahead of 2025 is the number that matters strategically — it means the logistics network is absorbing greater coal movement than a year ago.
SECTION 7 — DOMESTIC NEWS: TOP COAL INDUSTRY HEADLINES
NOTE: All news items below require direct URL verification before publication distribution. URLs provided are to primary sources; verify links are live and article-specific before final release.
1. DOE RENEWS 202(c) EMERGENCY ORDERS FOR INDIANA COAL PLANTS THROUGH JUNE 21
The U.S. Department of Energy issued renewed Section 202(c) emergency orders this week requiring NIPSCO and CenterPoint Energy to keep the R.M. Schahfer and F.B. Culley generating stations in Indiana operational through at least June 21, 2026 — extending the original December 2025 orders. Energy Secretary Chris Wright stated the orders are necessary to prevent power shortages and maintain Midwest grid reliability. At a Tuesday hearing before the Indiana Utility Regulatory Commission, NIPSCO President and COO Vince Parisi said compliance will require in excess of $100 million in capital investment alone, on top of ongoing operating expenses. One Schahfer unit has been offline since last summer and is still under evaluation for repairs. The orders have drawn legal challenges from environmental groups and cost objections from utilities and ratepayer advocates.
Source: Casey Smith, Indiana Capital Chronicle, March 26, 2026 Verified URL: https://indianacapitalchronicle.com/2026/03/26/utilities-warn-of-soaring-costs-related-to-trump-order-for-indiana-coal-plants-to-stay-open/
2. SECTION 202(c) ORDERS NOW COVER 5 COAL PLANTS IN 4 STATES — LEGAL BATTLES MOUNTING
Federal emergency orders blocking coal plant retirements now cover facilities in Indiana (Schahfer and Culley), Michigan (J.H. Campbell), Colorado (Craig Station), and Washington state (Centralia Unit 2). Three of the five plants have produced little or no electricity since the orders took effect — either due to mechanical failures requiring costly repairs or because regional power demand has been met without them. J.H. Campbell in Michigan has accrued $135 million in net costs since its order was first issued in May 2025; Consumers Energy is seeking to recover those costs from ratepayers across 11 states. Grid Strategies LLC analysis estimates that keeping aging coal plants open under these orders could cost ratepayers $3–6 billion annually if extended across the full fleet of retirement candidates during Trump’s term. Legal challenges are active in the D.C. Circuit (Campbell), the Ninth Circuit (Centralia), and in state proceedings in Colorado and Indiana.
Source: Alex Brown, Stateline / States Newsroom, March 19, 2026 Verified URL: https://stateline.org/2026/03/19/trump-is-forcing-coal-plants-to-stay-open-it-could-cost-customers-billions/
3. WARRIOR MET BLUE CREEK MET COAL RAMP AHEAD OF SCHEDULE — Q4 2025 RESULTS CONFIRMED
Warrior Met Coal’s Blue Creek mine in Alabama produced 1.3 million short tons in Q4 2025 alone — contributing to a record quarterly total of 3.4 million short tons company-wide, up 61% from Q4 2024. Blue Creek longwall commissioning began in October 2025, eight months ahead of the original schedule and on budget. For full-year 2025, Warrior produced a record 10.2 million short tons. The EIA March 2026 STEO cited Blue Creek as the primary driver behind a projected +7% increase in U.S. metallurgical coal exports in 2026. Core Natural Resources’ Leer South and Allegheny Metallurgical’s Longview mine restarts are additional met coal supply additions entering the seaborne market this year. Combined, these capacity additions position U.S. met coal producers to capture market share being vacated by constrained Australian supply.
Source (earnings data): BusinessWire / Warrior Met Coal, February 12, 2026 Verified URL: https://www.businesswire.com/news/home/20260212428401/en/Warrior-Reports-Fourth-Quarter-and-Full-Year-2025-Results Source (export forecast): EIA Short-Term Energy Outlook, March 10, 2026 Verified URL: https://www.eia.gov/outlooks/steo/
4. DATA CENTER DEMAND DRIVING GRID STRESS ACROSS PJM AND ERCOT — EIA FLAGS PRICE SPIKE RISK
EIA analysis released March 12 projected ERCOT electricity generation growing 7.3% in 2026, with a high-demand scenario modeling a potential 79% electricity price spike in the region by 2027. Nationally, signed large-load capacity commitments from data centers and AI infrastructure have reached 183 GW — equal to 22% of 2025 peak load. PJM is managing an unprecedented interconnection queue dominated by data center applications in Virginia, Ohio, and Pennsylvania. MISO and WECC face similar pressure. NERC’s January 2026 Long-Term Reliability Assessment flagged 13 of 23 North American reliability regions at elevated or high risk — the most significant reliability deficit recorded in a January LTRA. Grid operators are increasingly candid that dispatchable generation (coal and gas) is the only resource category that can fill peak demand gaps reliably.
Source: EIA, ‘ERCOT electricity market analysis,’ March 12, 2026; EIA March 2026 STEO; NERC LTRA January 2026 Primary URL: https://www.eia.gov/ (no single article URL — EIA data release March 12) STEO: https://www.eia.gov/outlooks/steo/ NERC LTRA: https://www.nerc.com/pa/RAPA/ra/Reliability%20Assessments%20DL/NERC_LTRA_2026.pdf
5. EPA MATS 2024 AMENDMENT ROLLBACK FINALIZED — EFFECTIVE APRIL 27, 2026
The EPA finalized repeal of the 2024 Mercury and Air Toxics Standards amendments on February 19, 2026, reverting coal-fired power plant hazardous air pollutant standards to the 2012 baseline. The final rule becomes effective April 27, 2026. The EPA’s accompanying Regulatory Impact Analysis confirmed that the agency did not quantify or monetize the health benefits or disbenefits of the rollback — an omission that has drawn litigation threats from environmental groups and legal commentary from Harvard’s Environmental & Energy Law Program. The practical effect for the industry: coal units that faced compliance capital requirements under the 2024 rule now operate under the less stringent 2012 standards, reducing near-term compliance cost pressure and extending the economic viability of aging units. Litigation is expected in the D.C. Circuit.
Source: U.S. Environmental Protection Agency, Final Rule, February 19, 2026 Verified URL (primary): https://www.epa.gov/stationary-sources-air-pollution/mercury-and-air-toxics-standards Direct fact sheet: https://www.epa.gov/system/files/documents/2026-02/mats-final-fact-sheet_repeal-of-2024-amendments_feb2026.pdf
6. EIA CONFIRMS COAL PLANT RETIREMENT DELAYS CONTINUING INTO 2026 — NERC RELIABILITY GAP WIDENS
The EIA March 2026 STEO flagged 4% of U.S. coal-fired generating capacity for planned retirement in 2026 — but the established pattern of delays is extending into the new year. In 2025, only 4.6 GW of the originally planned 12.3 GW in coal retirements actually materialized. NERC’s January 2026 Long-Term Reliability Assessment identified 13 of 23 North American reliability regions at elevated or high risk. The EIA March STEO acknowledged explicitly that DOE emergency orders and grid reliability pressures are creating conditions for retirement delays to continue. Every gigawatt of coal capacity preserved through delay or emergency order is a gigawatt that continues to consume coal and support demand for production. The cumulative effect across the fleet is material.
Source: EIA Short-Term Energy Outlook, March 10, 2026; NERC LTRA January 2026 Verified URL (STEO): https://www.eia.gov/outlooks/steo/report/elec_coal_renew.php Full STEO PDF: https://www.eia.gov/outlooks/steo/pdf/steo_full.pdf
7. NSW, AUSTRALIA FORMALIZES ‘NO NEW COAL MINES’ POLICY THROUGH 2050
The New South Wales government released the NSW Coal Industry 2026–50 policy on March 19, formally codifying the long-standing de facto position against new greenfield coal mine approvals. The policy makes no distinction between thermal coal and metallurgical coal. For existing NSW coal operators, the policy provides regulatory certainty for current mines and their extensions — the framework does not close existing operations. For U.S. metallurgical coal producers, the strategic implication is meaningful: one of the world’s largest coal-exporting jurisdictions has permanently removed new greenfield capacity from its pipeline, reducing long-term competition in the seaborne hard coking coal market. With Blue Creek, Leer South, and Central Appalachian met coal operations scaling up, the U.S. is expanding at precisely the moment Australian supply growth is being structurally capped.
Source: Clayton Utz, March 2026 Verified URL: https://www.claytonutz.com/insights/2026/march/a-new-chapter-what-the-nsw-coal-industry-2026-50-policy-means-for-the-future-of-coal-mining-in-new-south-wales
8. DOI ENERGY DOMINANCE FRAMEWORK CONTINUES — FEDERAL COAL LEASING OPEN
The Department of the Interior, under Secretary Doug Burgum, continues implementing the Trump administration’s Energy Dominance executive order framework, keeping federal lands open for coal leasing under the BLM. The DOI’s original April 2025 announcement under Secretary Burgum’s ‘Mine, Baby, Mine’ framework remains in effect and active. BLM lease activity in Wyoming’s Powder River Basin and federal mineral rights reviews in Appalachia are proceeding. No new major lease announcements were issued this week, but the leasing pipeline is active — a significant contrast with the effective moratorium under the prior administration. The framework is also the regulatory backdrop for coal operators considering expansion of federal-land operations in response to the current price environment.
Source: U.S. Department of the Interior, April 9, 2025 (framework announcement, ongoing) Verified URL: https://www.doi.gov/pressreleases/department-interior-moves-restore-coal-industry
SECTION 8 — INTERNATIONAL NEWS: GLOBAL COAL MARKET DEVELOPMENTS
1. NEWCASTLE CLOSES AT $135.60/MT — NEAR ONE-YEAR HIGH AS LNG CRISIS DEEPENS
ICE Newcastle thermal coal futures closed at $135.60 per metric ton on March 27, 2026 — within $5 of the 52-week high of $140.50 and up more than 40% year-over-year. The 52-week low was $93.25. The primary driver is the Hormuz disruption and QatarEnergy’s force majeure on Ras Laffan LNG output following Iranian missile strikes. European utilities are bidding aggressively for non-LNG thermal fuel, driving EU coal futures higher for multiple consecutive sessions this past week. Asian buyers — South Korean and Japanese utilities in particular — are securing thermal coal under term contracts to hedge against continued LNG price volatility. The EIA March 2026 STEO acknowledged explicitly that sustained Hormuz disruption could push U.S. thermal coal exports above the 44 MMst baseline, calling this a live scenario rather than a tail risk.
Source: Investing.com / ICE (real-time); 52-week range and March 27 close confirmed Verified URL (Investing.com): https://www.investing.com/commodities/newcastle-coal-futures Verified URL (Barchart ICE): https://www.barchart.com/futures/quotes/LQ*0/futures-prices EIA STEO export context: https://www.eia.gov/outlooks/steo/pdf/steo_full.pdf
2. INDONESIA’S OUTPUT CUT NOW IN QUESTION — PRICE RALLY PROMPTS RELAXATION SIGNALS
Indonesia entered 2026 with a formal production target of approximately 600 million tons — a 24% cut from the 790 million ton output in 2025 — aimed at stabilizing global thermal coal prices. That cut initially strengthened the bullish market case. As of March 26, however, Indonesia’s Energy Minister Bahlil Lahadalia signaled that the government may relax production quotas if high prices persist, citing the need to capture revenue at elevated price levels amid the Hormuz-driven market rally. Miners can submit amendments to their annual RKAB production plans by mid-year. The possible relaxation introduces upside supply uncertainty into a market that was pricing in the full benefit of Indonesian supply discipline. The net effect for U.S. exporters: the current price window may be time-limited if Indonesian miners ramp back up into the price rally.
Source (initial cut): ANTARA News, January 8, 2026 Verified URL: https://en.antaranews.com/news/399053/indonesia-to-cut-coal-production-to-around-600-million-tons-in-2026 Source (relaxation signal): The Jakarta Post, March 26, 2026 Verified URL: https://www.thejakartapost.com/business/2026/03/26/indonesia-may-relax-production-quotas-of-nickel-coal-if-prices-stay-high.html
3. CHINA COAL DEMAND RECOVERY PROJECTED FOR 2026 AS POWER DEMAND REACCELERATES
Analysis from Kpler, cited by globalCOAL in March 2026, projects Chinese coal demand to recover this year after a 2025 deceleration driven by weak economic growth and record renewable energy generation additions. China’s pipeline of more than 100 new coal-fired power generators scheduled to come online in 2026 — with 400-plus additional units under construction — represents a structural demand floor for thermal coal regardless of renewable expansion. Chinese met coal demand from domestic steel producers also remains a baseline driver for seaborne hard coking coal. In 2025, Chinese coal imports from Indonesia declined roughly 16% year-over-year, but that moderation reflected inventory overhang and domestic production strength rather than structural demand collapse. As that overhang clears through 2026, import volumes are expected to normalize.
Source: globalCOAL Market News (March 2026), citing Kpler whitepaper Verified URL: https://www.globalcoal.com/news-events/news.cfm Note: Direct Kpler whitepaper URL not publicly available; globalCOAL serves as the cited publication of record.
4. EUROPEAN COAL DEMAND REVIVAL ACCELERATES — EU STORAGE AT 28.3% AS OF MARCH 27
EU underground gas storage stood at 28.3% capacity as of March 27, 2026, according to the Gas Infrastructure Europe (GIE) AGSI database — approximately 20 percentage points below the same date in 2025 and well below the five-year seasonal average. The Netherlands is at 6%. With QatarEnergy’s Ras Laffan LNG facility offline under force majeure, European utilities have no viable large-scale alternative to coal for rapid dispatchable power scaling this spring. This marks the second major European coal demand revival since the 2022 Russia-Ukraine energy shock. Bruegel’s weekly European natural gas import tracker (updated March 26) confirms that EU storage withdrawals are easing but storage remains critically low as the spring injection season approaches — raising the urgency for non-gas baseload fuel procurement. CAPP and NAPP steam grades are geographically positioned to serve the European market through Hampton Roads and Baltimore terminals.
Source: Gas Infrastructure Europe (GIE) / AGSI+ database, status as of March 27, 2026 at 6AM CEST Verified URL (GIE): https://www.gie.eu/ Direct AGSI data: https://agsi.gie.eu/ Verified URL (Bruegel European gas imports): https://www.bruegel.org/dataset/european-natural-gas-imports
5. AUSTRALIAN MET COAL SUPPLY DISRUPTIONS CONTINUE — UNDERPIN U.S. EXPORT POSITION
Australian metallurgical coal export volumes are running below prior-year levels due to a combination of mine accidents in Queensland, adverse weather events, and the low-price environment of 2024 into early 2025 that reduced capital investment in mine development and maintenance. The EIA March 2026 STEO cited Australian met coal supply disruptions as a specific driver of elevated hard coking coal prices and as an explicit supporting condition for its +7% U.S. met coal export forecast for 2026. With Warrior Met’s Blue Creek, Core Natural Resources’ Leer South, and Allegheny Metallurgical’s Longview mine all ramping production into a supply-constrained market, U.S. producers are operationally positioned to absorb market share that Australian operators are unable to fill. The NSW 2026–50 policy formalizing the no-new-greenfield-mines position removes Australian growth optionality as a long-term competitive pressure.
Source: EIA Short-Term Energy Outlook, March 10, 2026 Verified URL: https://www.eia.gov/outlooks/steo/pdf/steo_full.pdf
SECTION 10 — SWOT ANALYSIS & STRATEGIC ASSESSMENT
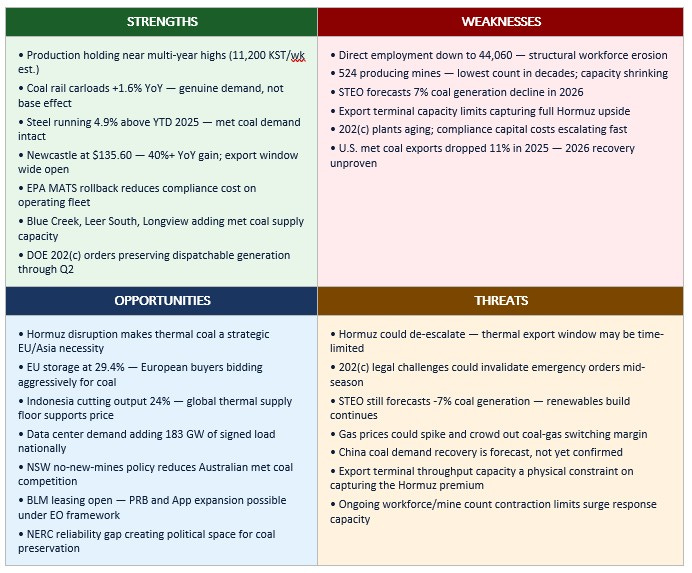
STRATEGIC OUTLOOK
When the Market Calls Your Name, Answer the Phone
By T.L. Headley, MBA, / President / The Hedley Company
CHARLESTON, W.Va. — There is a moment in every market cycle when circumstances align so favorably that the only way to lose is to be unprepared. The American coal industry is sitting in one of those moments right now, and the question is whether it can move fast enough to capture it.
Newcastle futures at $135.60 a metric ton. European underground gas storage at 29.4% capacity — 32% below the five-year average and still draining. QatarEnergy under force majeure since Iranian missiles hit Ras Laffan in late February. Twenty percent of the world’s LNG supply has been removed from the market. European utilities and Asian importers are not debating philosophy about energy transition timelines right now. They are bidding for every available non-LNG thermal fuel that can be contracted, shipped, and burned before summer demand peaks.
The EIA March STEO’s 44 MMst thermal export baseline was already a modest uptick over 2025’s depressed 93 MMst total export figure. That baseline assumed no sustained Hormuz disruption. The disruption is sustained. The EIA acknowledged explicitly that higher-than-forecast thermal exports are a live scenario — not a tail risk, but the probable scenario if the current geopolitical situation persists. The window will not stay open indefinitely. It never does. But right now it is open, and the spread between what U.S. CAPP and NAPP steam coal is worth domestically and what it will fetch on the European spot market is as wide as it has been since the Russia-Ukraine shock of 2022.
The met coal story is equally compelling, though operating on a different timeline. Warrior Met Coal’s Blue Creek mine contributed 1.3 million short tons in a single quarter — and the ramp is not complete. Leer South is back. Longview is back. Australian supply is constrained by underinvestment, mine accidents, and a weather pattern that the southern Queensland coalfields have not been kind about this season. The seaborne hard coking coal market is tightening precisely at the moment U.S. capacity is expanding. EIA’s +7% met export forecast for 2026 may prove conservative if Australian disruptions persist through Q2.
On the domestic side, the grid reliability picture grows more consequential every week. NERC’s January 2026 assessment — 13 of 23 reliability regions at elevated or high risk — is not a bureaucratic finding. It is a warning that the U.S. power system has retired too much dispatchable generation too fast and replaced it with too little reliable capacity. The DOE’s Section 202(c) orders are a blunt instrument. They cost money, some of the plants are genuinely past their useful lives, and the legal challenges are real. But the underlying premise — that baseload dispatchable generation is irreplaceable in a grid that must respond to actual demand, not forecasted wind conditions — is correct. The data center buildout that everyone is celebrating will require power that intermittent sources cannot reliably provide. Someone is going to have to say that plainly in front of a congressional committee and defend it with numbers. The industry should be preparing that testimony.
The SWOT picture this week is unusually favorable on the opportunity side. Indonesia cutting output by 24% is a structural supply signal that will not reverse overnight. The NSW government formalizing its ban on new greenfield coal mines removes long-term competition from one of the world’s most prolific coal-exporting jurisdictions. The NERC reliability gap creates political space for preservation of coal-fired capacity that was unimaginable two years ago. BLM leasing is open. The EPA has stepped back from the 2024 MATS overreach.
The industry’s challenge is not strategic. It knows what it has. The challenge is operational and logistical: moving tons at the throughput the market will currently absorb, positioning export capacity to capture the Newcastle premium, and maintaining a workforce base that can respond to a surge. Hampton Roads, Baltimore, Mobile, and the Gulf Coast terminals need to be running hard. Rail operating plans need to prioritize export unit train movements. Contracts need to be written at prices that reflect today’s market, not last year’s assumptions.
When the market calls your name, you answer the phone.
— T.L. Headley, MBA
President, The Hedley Company | Founder & VP Communications, The Seneca Center for Energy and Critical Mineral Research
Charleston, W.Va.
COAL CURRENTS — STANDARD DISCLAIMER AND PUBLICATION INFORMATION
Coal Currents is published weekly by The Hedley Company, 169 Raceview Drive, Ona, WV 25545. Publisher: T.L. Headley, MBA, MA. Work phone: 681.279.0484. Work email: [email protected]. All data and analysis are for informational purposes only and do not constitute investment, legal, or regulatory advice. Production and employment estimates are analyst constructions pending official EIA release and should be verified before regulatory or contractual use.
Research and drafting for this publication was conducted with AI assistance under the direction and editorial control of the author.
Coal Currents is a publication of The Hedley Company. The Seneca Center for Energy and Critical Mineral Research is a separately incorporated entity. For subscription inquiries, media requests, or data corrections, contact the publisher at the address above.
Coal Currents | Week Ending March 29, 2026 | A Publication of The Hedley Company | © 2026 T.L. Headley, MBA, MA