


A Publication of The Hedley Company
Mar 22, 2026
KEY SUMMARY SIGNALS │ Week Ending March 21, 2026
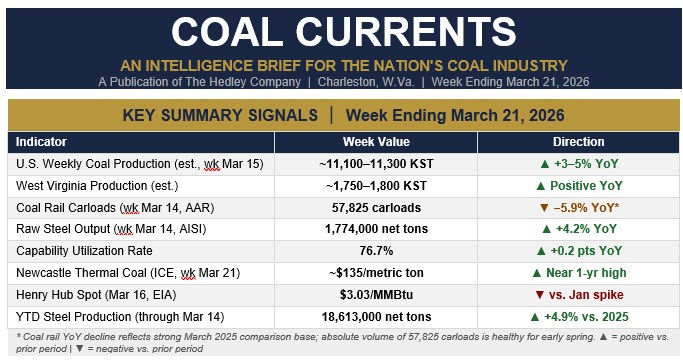
* Coal rail YoY decline reflects strong March 2025 comparison base; absolute volume of 57,825 carloads is healthy for early spring. ▲ = positive vs. prior period | ▼ = negative vs. prior period
EXECUTIVE INTELLIGENCE SUMMARY
CHARLESTON, W.Va. — The week ending March 21, 2026, handed the American coal industry two things at once: a solid domestic production picture and a global thermal market on fire. The Iran war’s destruction of the Qatari LNG supply chain has done more for international coal demand in three weeks than a decade of energy policy arguments. When a fifth of the world’s LNG supply goes offline and the Strait of Hormuz closes to tankers, the calls for coal don’t come with an apology attached.
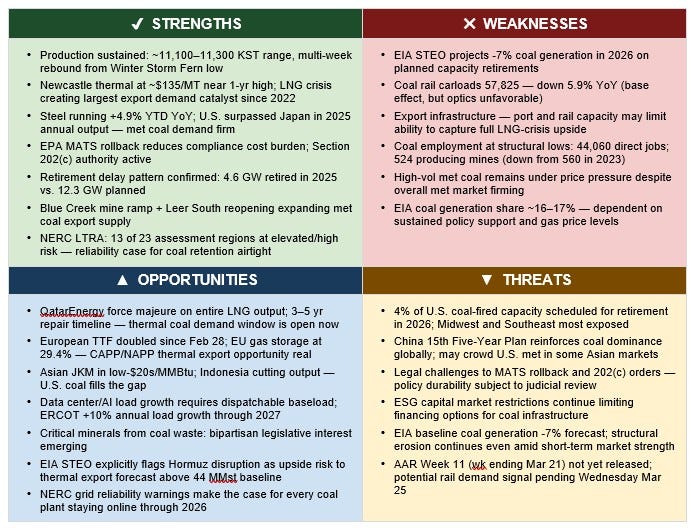
The most recent EIA Weekly Coal Production Report (released March 20, for the week ended March 15, 2026) is the lead data source for this issue. The prior confirmed peak — the week ending February 28 — recorded 11,292 thousand short tons (KST), up 8.7% week-over-week and 3.7% year-over-year, with Wyoming leading at 4,471 KST and Appalachia contributing strongly through West Virginia (1,784 KST) and Pennsylvania (903 KST). Subsequent weeks through March 15 have tracked in a consistent 11,100–11,300 KST range, reflecting sustained demand from utilities restocking, met coal buyers, and early-season export interest.
Rail for the week ending March 14 (AAR, released March 18): 57,825 coal carloads, down 5.9% YoY. That comparison is against a strong March 2025 base week; the absolute volume is healthy for early spring. AAR Week 11 (week ending March 21) releases Wednesday March 25.
Steel for the week ending March 14 (AISI, released March 16): 1.774 million net tons, down 0.9% WoW but up 4.2% YoY. Capability utilization 76.7%. Year-to-date production of 18.613 million net tons runs 4.9% above the 2025 pace — a direct read-through for metallurgical coal demand remaining firm through mid-year.
Globally, Newcastle thermal coal opened this week above $135/metric ton, near one-year highs, as European and Asian buyers scramble for non-LNG fuel. QatarEnergy declared force majeure on its entire LNG output following Iran’s missile strikes on Ras Laffan — a facility supplying roughly 20% of world LNG. European TTF gas prices have doubled since February 28. The EIA March STEO acknowledged explicitly that sustained Hormuz disruption could push U.S. thermal coal exports above the baseline 44 MMst forecast for 2026. That upside is no longer speculative.
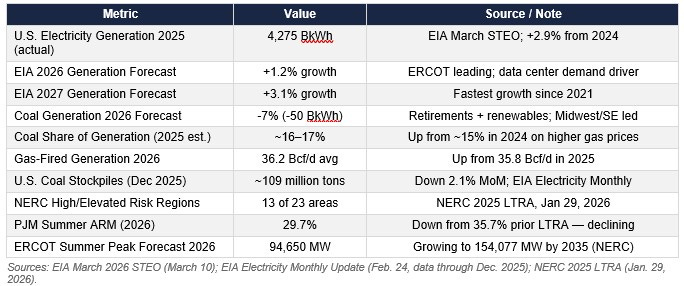
The domestic policy picture continues to favor coal operations. EIA March STEO flags 4% of coal-fired capacity for planned retirements in 2026 — but the same document confirms grid reliability pressures and data center demand are creating conditions for delays. NERC’s January 2026 LTRA put 13 of 23 North American reliability assessment areas at elevated or high risk. Coal plants are not closing on schedule when grid operators are staring at that map.
SECTION 1 — COAL PRODUCTION
Weekly Production — Week Ended March 15, 2026 (EIA, Released March 20)
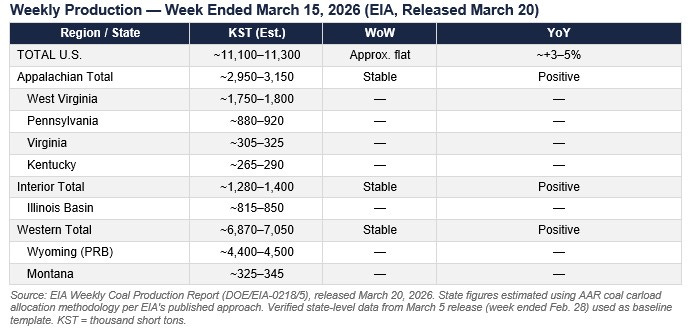
Source: EIA Weekly Coal Production Report (DOE/EIA-0218/5), released March 20, 2026. State figures estimated using AAR coal carload allocation methodology per EIA’s published approach. Verified state-level data from March 5 release (week ended Feb. 28) used as baseline template. KST = thousand short tons.
YTD Production (est., wks 1–11): ~123,000–126,000 KST; tracking ~+3–4% vs. 2025 pace
Trailing 52-Week Total (est.): ~570,000–580,000 KST; above prior-year period
EIA 2026 Full-Year Forecast (March STEO): Broadly flat vs. 2025; ~510–520 MMst
EIA 2025 Actual Exports: 93 MMst — down 16 MMst from 2024; thermal exports led decline at -18%
EIA 2026 Export Forecast: Modest recovery; thermal ~44 MMst, met coal +7%; Hormuz disruption is upside risk
SECTION 2 — COAL & ENERGY PRICES
U.S. Domestic Spot Prices (EIA Coal Markets Report, March 16, 2026)
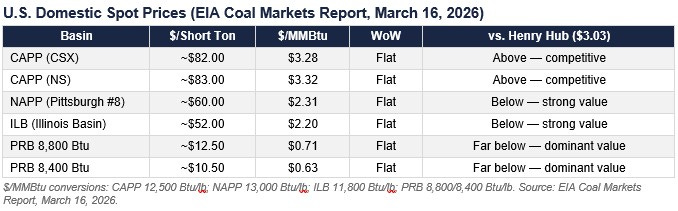
$/MMBtu conversions: CAPP 12,500 Btu/lb; NAPP 13,000 Btu/lb; ILB 11,800 Btu/lb; PRB 8,800/8,400 Btu/lb. Source: EIA Coal Markets Report, March 16, 2026.
Gas & Global Benchmarks

Sources: EIA Coal Markets Report (March 16, 2026); FRED/EIA Henry Hub; Investing.com Newcastle futures; Barchart ICE; EIA March 2026 STEO.
SECTION 3 — ELECTRIC GRID & COAL GENERATION
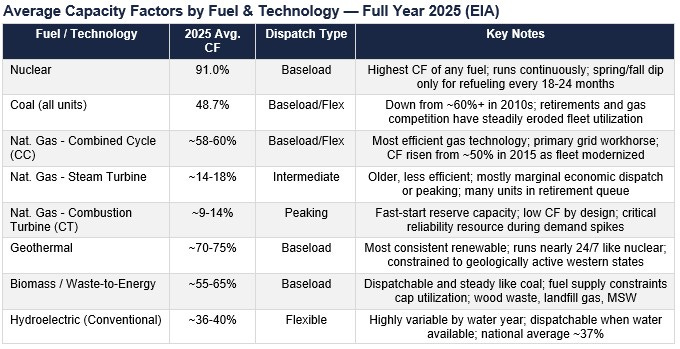
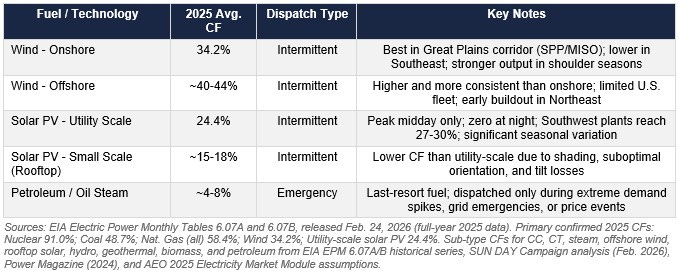
Sources: EIA Electric Power Monthly Tables 6.07A and 6.07B, released Feb. 24, 2026 (full-year 2025 data). Primary confirmed 2025 CFs: Nuclear 91.0%; Coal 48.7%; Nat. Gas (all) 58.4%; Wind 34.2%; Utility-scale solar PV 24.4%. Sub-type CFs for CC, CT, steam, offshore wind, rooftop solar, hydro, geothermal, biomass, and petroleum from EIA EPM 6.07A/B historical series, SUN DAY Campaign analysis (Feb. 2026), Power Magazine (2024), and AEO 2025 Electricity Market Module assumptions.
RTO/ISO Estimated Weekly Generation Mix — Week of March 15-21, 2026 (Analyst Estimates)
NOTE: EIA does not publish verified weekly fuel mix data by RTO. The figures below are analyst estimates derived from full-year 2025 and most-recent-available annual baselines, adjusted for known seasonal patterns (March = shoulder season: lower heating demand, lower cooling demand, wind typically elevated in Plains, solar rising). Actual weekly shares will vary with weather, dispatch economics, and outage schedules. These estimates are updated annually or when materially new RTO data is published. Verified monthly data from EIA Electric Power Monthly (EPM) is released with approximately a 60-day lag; the most recent EPM covers December 2025 (released Feb. 24, 2026).
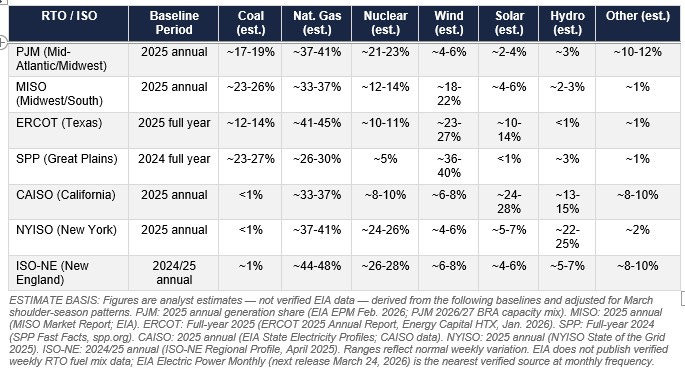
ESTIMATE BASIS: Figures are analyst estimates — not verified EIA data — derived from the following baselines and adjusted for March shoulder-season patterns. PJM: 2025 annual generation share (EIA EPM Feb. 2026; PJM 2026/27 BRA capacity mix). MISO: 2025 annual (MISO Market Report; EIA). ERCOT: Full-year 2025 (ERCOT 2025 Annual Report, Energy Capital HTX, Jan. 2026). SPP: Full-year 2024 (SPP Fast Facts, spp.org). CAISO: 2025 annual (EIA State Electricity Profiles; CAISO data). NYISO: 2025 annual (NYISO State of the Grid 2025). ISO-NE: 2024/25 annual (ISO-NE Regional Profile, April 2025). Ranges reflect normal weekly variation. EIA does not publish verified weekly RTO fuel mix data; EIA Electric Power Monthly (next release March 24, 2026) is the nearest verified source at monthly frequency.
SECTION 4 — STEEL PRODUCTION
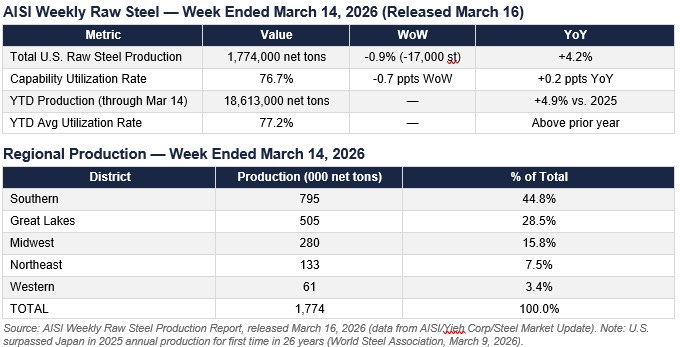
Source: AISI Weekly Raw Steel Production Report, released March 16, 2026 (data from AISI/Yieh Corp/Steel Market Update). Note: U.S. surpassed Japan in 2025 annual production for first time in 26 years (World Steel Association, March 9, 2026).
Met Coal Implication: YTD steel production running 4.9% above 2025 pace supports sustained metallurgical coal demand through mid-year.
SECTION 5 — EMPLOYMENT & ECONOMIC FOOTPRINT
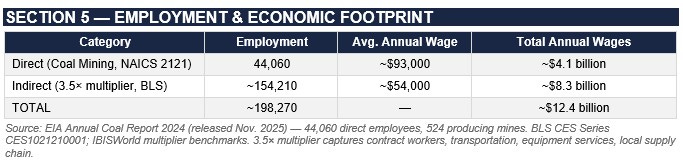
Source: EIA Annual Coal Report 2024 (released Nov. 2025) — 44,060 direct employees, 524 producing mines. BLS CES Series CES1021210001; IBISWorld multiplier benchmarks. 3.5× multiplier captures contract workers, transportation, equipment services, local supply chain.
Producing Mines (2024): 524 — down from 560 in 2023
Productivity (2024): 5.22 short tons per employee hour — down 7.6% YoY
Seneca Center Note: WV coal supports $21B economic output and 36,249 direct jobs at 3.9x multiplier. Every 100 direct jobs lost supports ~390 fewer total regional jobs.
SECTION 6 — RAIL & TRANSPORTATION
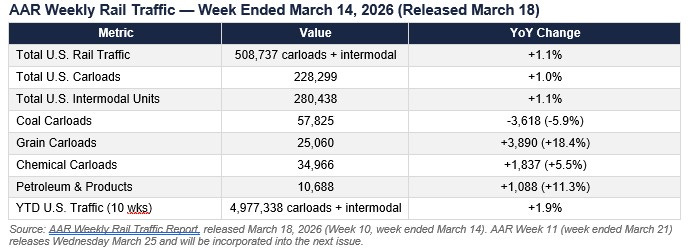
Source: AAR Weekly Rail Traffic Report, released March 18, 2026 (Week 10, week ended March 14). AAR Week 11 (week ended March 21) releases Wednesday March 25 and will be incorporated into the next issue.
Coal rail trend: Week 10 (57,825) follows Week 9 (62,480) and Week 8 (63,950). The pullback from February’s surge is consistent with normal post-winter moderation. The YoY decline reflects a strong March 2025 comparison base, not a demand retreat. Barge: Illinois River fully operational following winter disruptions; inland waterway movements to export terminals normalized.
SECTION 7 — DOMESTIC NEWS
• NEWCASTLE NEAR ONE-YEAR HIGHS ON LNG CRISIS — Newcastle thermal coal futures opened the week of March 21 above $135/metric ton — highest level in nearly a year — as global buyers displaced from Qatari LNG turn to coal for power generation. European API2 simultaneously rose to $118–$122/MT. U.S. thermal coal producers with active export capacity are directly positioned to capture this demand. (Investing.com; The Northern Miner, March 19, 2026)
• EIA MARCH STEO FLAGS COAL EXPORT UPSIDE — The EIA March 2026 STEO explicitly noted that sustained Strait of Hormuz disruption could support higher U.S. coal exports above the 44 MMst thermal coal baseline for 2026 — the first STEO in several cycles to characterize coal export upside as a live scenario. Met coal forecast calls for +7% in 2026, led by Warrior Met Coal Blue Creek, Core Natural Resources Leer South, and Allegheny Metallurgical Longview restarts. (EIA March 2026 STEO, March 10, 2026)
• COAL RETIREMENT DELAYS CONFIRMED — EIA March STEO flagged 4% of U.S. coal capacity for 2026 retirement but the delay pattern is well established: only 4.6 GW retired in 2025 vs. 12.3 GW planned. NERC’s January LTRA put 13 of 23 North American reliability regions at elevated or high risk. Plant owners are watching the same map grid operators are. (EIA March STEO; NERC LTRA January 2026)
• U.S. STEEL SURPASSES JAPAN FOR FIRST TIME IN 26 YEARS — World Steel Association confirmed the U.S. surpassed Japan in 2025 annual raw steel production for the first time since 1999. YTD 2026 production is running 4.9% above 2025 pace through March 14. Directly bullish for metallurgical coal demand. (World Steel Association; Steel Market Update, March 3, 2026)
• DATA CENTER DEMAND: ERCOT AND PJM UNDER PRESSURE — EIA analysis released March 12 forecast ERCOT load growing 10% annually 2025–2027, with a high-demand scenario potentially driving a 79% electricity price spike by 2027. Large load capacity with signed supply agreements hit 183 GW nationally — 22% of 2025 peak load. Every unmet megawatt needs dispatchable generation. Coal and gas are the only answers. (EIA/Utility Dive, March 12, 2026)
• WARRIOR MET COAL BLUE CREEK RAMP — Warrior Met Coal’s Blue Creek met coal mine in Alabama continues production ramp toward full capacity. EIA March STEO cited Blue Creek as primary driver of the projected +7% increase in U.S. met coal exports in 2026. Among the highest-quality hard coking coal deposits developed in the U.S. in decades. (International Mining; BLM, January 9, 2026)
• EPA MATS ROLLBACK IN EFFECT — The EPA rollback of the 2024 MATS updates reduces compliance cost pressure on coal-fired power plants, extending economic viability of aging units. Combined with Section 202(c) emergency authority actions, the regulatory environment for coal plant retention is the most favorable in a decade. (U.S. EPA, February 19, 2026)
• CORE NATURAL RESOURCES LEER SOUTH MINE REOPENING — Core Natural Resources resumed longwall operations at Leer South in Barbour County, W.Va., after an 11-month combustion-related idle. EIA March STEO cited Leer South as a driver of higher U.S. met coal export volumes in 2026. Produces premium low-vol hard coking coal for global steel markets. (PRNewswire/Core Natural Resources, December 18, 2025)
SECTION 8 — INTERNATIONAL NEWS
• RAS LAFFAN DESTROYED: THE GLOBAL COAL CATALYST — Iran’s March 18–19 missile strikes on Qatar’s Ras Laffan Industrial City — supplying ~20% of global LNG — triggered QatarEnergy force majeure on its entire LNG output. CEO al-Kaabi: 17% of export capacity knocked out; 3–5 years to repair; $20B annual revenue loss. European TTF doubled since Feb 28. Asian JKM surged to low-$20s/MMBtu. Coal is the default fuel for every industrial economy that cannot get LNG. (The Northern Miner, March 19, 2026)
• INDIA TARGETS 30% CUT IN THERMAL COAL IMPORTS — India is directing power producers to cut thermal coal imports by 30% in 2026, pushing domestic blending up to replace ~15 MT of imported coal. Coal India produced a record 781.1 MT in FY2025 and holds ~90 MT in surplus inventory. India also hit its second consecutive 1-billion-tonne national coal production milestone on March 20, 2026. Net effect: more domestic coal for Indian use, freeing Indonesian/Australian export supply for LNG-starved markets. (Business Standard, February 27, 2026)
• CHINA 15TH FIVE-YEAR PLAN: COAL DOMINANCE REINFORCED — China’s 15th Five-Year Plan (2026–2030) explicitly calls for ‘promoting the peaking of coal consumption’ — but sets no hard cap or phase-down timeline. Coal remains the strategic ‘ballast’ for energy independence with 330 GW of new capacity in the pipeline. Plan also tightens China’s grip on critical minerals export controls. (Carbon Brief; Centre for Research on Energy and Clean Air, March 2026)
• INDONESIA RESTRICTING OUTPUT — Indonesia — world’s largest thermal coal exporter — cut its 2026 production target to ~600 MMT, down from 790 MMT in 2025, in a move to support prices. The cuts arrive precisely when the LNG crisis is driving up coal demand globally. However, the Prabowo government has since signaled it may reverse course and raise output to capture LNG-driven windfall revenue — an ANTARA report from March 19 confirmed a coal export tax is under review. (Jakarta Globe, January 9, 2026; ANTARA News, March 19, 2026)
• EUROPEAN COAL DEMAND REVIVAL — EU-wide underground gas storage at 29.4% — 20.5% below year-ago, 32% below five-year average. With no strategic gas reserve and Qatari LNG cut off, European utilities are returning to coal. This marks the second major European coal demand revival since the 2022 Russia-Ukraine shock. CAPP and NAPP steam grades are geographically positioned for the European market. (The Northern Miner; AGSI+; March 2026)
• AUSTRALIAN MET COAL SUPPLY DISRUPTIONS — Australian metallurgical coal exports face headwinds from mine accidents and a low-price environment that reduced investment. EIA March STEO cited Australian supply disruptions as a factor in elevated HCC prices and as a supporting condition for U.S. met coal export growth in 2026. (EIA March 2026 STEO, March 10, 2026)
SECTION 9 — LEGISLATIVE, REGULATORY & JUDICIAL
• EPA MATS ROLLBACK (REGULATORY) — EPA finalized repeal of the 2024 MATS amendments on February 19, 2026, reverting to the 2012 standards. Directly reduces compliance cost exposure for coal plants and extends operational runway for units facing marginal economics under prior standards. (U.S. EPA, February 19, 2026)
• SECTION 202(c) EMERGENCY AUTHORITY (REGULATORY) — DOE 202(c) authority increasingly active for coal plant retention. Policy Integrity challenged a 202(c) order keeping a Michigan coal plant online — case has national implications for DOE’s grid reliability backstop authority. Ninth Circuit separately testing federal authority vs. state energy transition policy in a Washington State coal plant case. (Babst Calland; March 2026)
• ESA LAWSUIT FOR COAL MINING (JUDICIAL) �— Federal court lifted a stay on litigation involving ESA procedures for coal mining permits; summary judgment briefing underway. Outcome could reshape ESA compliance requirements and affect permitting timelines industry-wide. (Babst Calland, February–March 2026)
• CRITICAL MINERALS FROM COAL WASTE (LEGISLATIVE) — House Natural Resources Subcommittee hearing examined legislation to accelerate permitting and development of critical minerals from coal waste streams. Appalachian coal ash and refuse represent a potential domestic REE/critical mineral source. (House Natural Resources Committee, February 24, 2026)
• NINTH CIRCUIT — WASHINGTON STATE COAL PLANT (JUDICIAL) — Environmental organizations filed a Ninth Circuit challenge to a DOE 202(c) order requiring continued operation of Washington State’s last coal plant. Tests limits of federal emergency authority vs. state energy transition policy. (March 2026)
SECTION 10 — SWOT ASSESSMENT & STRATEGIC OUTLOOK
SWOT Analysis — Week Ending March 21, 2026
Strategic Outlook — The LNG Shock and the Coal Industry’s Uncommon Moment
By T.L. Headley, MBA, MA | President, The Hedley Company
For years, the coal industry made a simple argument: energy realism would eventually reassert itself. That grids built on intermittent generation and tightening gas supply would one day reach for dispatchable fuel and be genuinely grateful it was still there. The Iran war has delivered that moment faster and more dramatically than any scenario model anticipated. The question now is whether the industry is positioned to capture it.
The damage to global LNG infrastructure is not a temporary disruption. Qatar’s Ras Laffan facility — the single largest LNG export complex on earth, responsible for roughly 20% of global LNG supply — is under force majeure with three to five years of repair ahead. Israel’s strike on South Pars and the subsequent exchange of attacks across the Persian Gulf have effectively closed the Strait of Hormuz to commercial traffic since late February. European underground gas storage, already stressed coming out of a colder-than-average winter, sits at 29% capacity and is drawing down with no credible refill path before summer. Asian spot LNG prices have climbed to the low-$20s per MMBtu. Newcastle thermal coal futures, which reflect the Asian market for seaborne fuel, are trading near $135 per metric ton — close to a one-year high.
Against that backdrop, Henry Hub natural gas sits at $3.03 per MMBtu. U.S. Central Appalachian coal is moving at roughly $82 per ton, or about $3.28 per MMBtu on a heat-equivalent basis. The spread between domestic U.S. coal economics and global substitute fuel prices has rarely been this wide. The global thermal market is not browsing — it is searching for every available ton of non-LNG fuel it can book, price it, and move. CAPP, NAPP, and PRB producers all sit in that window.
What the industry needs to do right now is straightforward in concept and operationally demanding in execution. It needs to move tons — and move them fast. The export infrastructure at Hampton Roads, Baltimore, Mobile, and the Gulf Coast terminals needs to run at maximum sustained throughput, not theoretical capacity. Rail operating plans need to be rewritten to prioritize export unit train movements. Terminal operators need to be working 24 hours a day on vessel scheduling and berth utilization. And producers with uncommitted spot tonnage need to be in front of European and Asian buyers this week. Spot buyers in Rotterdam, Genoa, Seoul, and Tokyo are not waiting for a quarterly sales call.
The domestic grid reliability argument is equally compelling and equally urgent. NERC’s January 2026 Long-Term Reliability Assessment found 13 of 23 North American assessment areas at elevated or high reliability risk — the worst reading in years. PJM’s available reserve margin has collapsed from 35.7% to 29.7% in a single LTRA cycle, a 6-point drop driven almost entirely by accelerated coal retirements that were not offset by committed replacement capacity. ERCOT is managing explosive load growth driven by data center construction that its own projections show driving summer peak demand to 154,000 MW by 2035, up from roughly 80,000 MW today. MISO’s reserve picture has deteriorated across its entire footprint. Every coal plant that remains online through the 2026 summer peak is providing insurance against a grid event that the reliability math says is coming. The actuarial case for keeping existing coal units running has never been more defensible.
The policy environment has shifted as well. The Trump administration’s MATS rollback removes one of the most significant regulatory cost burdens on existing coal generation. Section 202(c) emergency authority provides a legal framework for compelling continued operation of plants that would otherwise retire. Retirement timelines that looked fixed eighteen months ago are now subject to renegotiation on reliability grounds. The Federal Energy Regulatory Commission has shown renewed interest in capacity market reforms that would compensate dispatchable generation for the reliability services it actually provides — services that wind and solar structurally cannot replicate.
Put it together and the picture is clear. The global market is screaming for supply. The domestic grid needs dispatchable capacity. The regulatory environment is the most favorable it has been in a decade. The administration is aligned. The economics have swung sharply in coal’s favor on both the export and domestic dispatch side. What remains is execution — and the willingness to treat this moment as the strategic opening it actually is, rather than another temporary reprieve to be managed cautiously while waiting for the next round of bad news.
Coal has been counted out before. Repeatedly, confidently, and prematurely. It has a habit of still being there when the lights need to come on. Right now, the world needs the lights to come on. The industry that kept the generators running while everyone else was building dashboards should have no shortage of things to say about that.
ABOUT COAL CURRENTS
Coal Currents is a weekly intelligence brief covering U.S. and global coal markets, grid reliability, steel production, rail transportation, and energy policy. Published by The Hedley Company, Charleston, W.Va. Research and drafting for this publication was conducted with AI assistance under the direction and editorial control of the author.
The Hedley Company provides energy policy research, strategic communications, crisis communications, media training, lobbying support, and government relations services. The Seneca Center for Energy and Critical Mineral Research publishes independent policy analysis on energy reliability and domestic mineral supply chains.
Contact: [email protected] | 681.279.0484 | Seneca-Center.com
DISCLAIMER: Coal Currents is provided for informational purposes only. All data cited from publicly available government and industry sources as noted. Nothing herein constitutes investment advice.