


The Duck Curve's Third Stage: When Solar Saturation Produces Negative Prices, Mass Curtailment, and a 17,000 MW Evening Wall
The duck curve — the net load shape produced by high solar penetration, characterised by midday depression and steep evening ramp — has passed through two evolutionary stages documented in the literature and is now in a third that grid operators and energy analysts need to distinguish clearly from its predecessors.
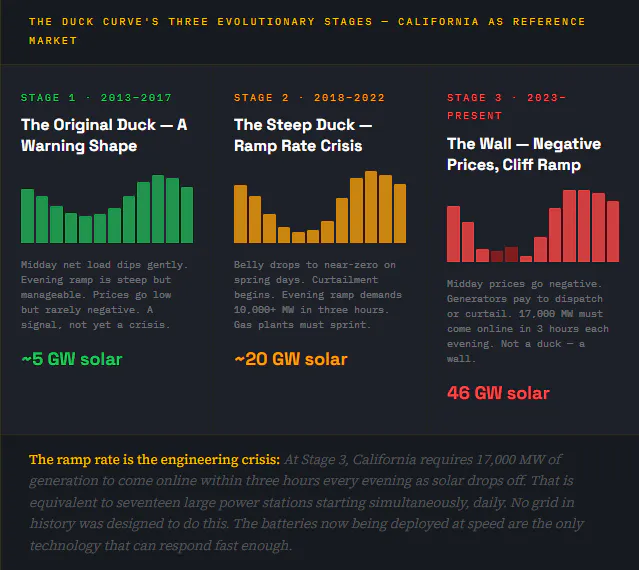
Stage one, observed in California between approximately 2013 and 2017, produced a modest midday net load depression with elevated but manageable evening ramp rates. Curtailment was minimal. Prices went low but rarely negative. The curve was a system planning concern, not an operational crisis.
Stage two, from approximately 2018 to 2022, produced deeper midday depression reaching near-zero net load on spring days, with evening ramp rates demanding 10,000 MW or more within three hours in CAISO. Curtailment grew materially. The ramp rate challenge drove the first significant wave of utility-scale battery storage procurement.
Stage three — the current operational reality in California, Germany, Spain, and parts of Texas — is qualitatively different from both predecessors. Midday prices go negative for sustained periods, not just briefly. Generators face the choice of curtailing or paying to dispatch. California curtailed 3.4 million MWh of wind and solar in 2024, a 29% increase over 2023, with solar accounting for 93% of curtailed energy. Germany's solar curtailment increased 97% year-over-year in 2024. In the Permian Basin, negative wholesale prices appeared in over 25% of all hours. Spain's solar capture rate fell from 0.70 to 0.36 in a single year.
The evening ramp at Stage 3 is the operational challenge that the "duck curve" label now undersells. California requires up to 17,000 MW of generation capacity to come online within three hours every evening. CAISO responded by deploying battery storage from approximately 500 MW in 2020 to over 13 GW by early 2025 — the only technology capable of charging at near-zero midday prices and discharging at scale within the three-hour ramp window.
For practitioners in emerging solar markets, the critical analytical point is that duck curve dynamics do not scale linearly with absolute installed solar capacity — they scale with solar capacity relative to grid peak demand. At approximately 25% solar penetration of total generating capacity, Stage 1 dynamics begin to appear regardless of absolute system size. Kenya's grid peaks at approximately 2 GW; 25% penetration corresponds to 500 MW. Kenya's installed solar capacity is approaching 900 MW. Ghana's peak demand of approximately 3.5 GW implies a Stage 1 threshold of roughly 875 MW. South Africa's Western Cape is already recording REIPPPP curtailment events during midday periods, constituting Stage 1 to early Stage 2 dynamics.
The engineering responses — co-located battery storage, demand-side flexibility through time-of-use tariff structures, direct industrial load co-location, and transmission export — are established. The constraint in African markets is not technical knowledge of these responses but the capital, regulatory frameworks, and grid operator capacity to deploy them before curtailment and negative pricing make the investment case for new solar projects questionable.
REM Episode 19 presents the three-stage evolution with representative net load profiles, curtailment and negative price data across CAISO, Germany, Spain, and ERCOT, and a comparative analysis of grid-size-adjusted solar penetration thresholds for key African markets.
Published at donfackfortune.medium.com.
Donfack Fortune is a mechanical engineer and energy systems analyst publishing Renewable Energy Mall & Engineering Review.