


Who are the real leaders of the energy transition? Not always where you'd expect.
A new cross-country analysis of the world's top 50 energy producers reveals a pattern worth sitting with: China and the United States — the two largest power systems on Earth, with nearly 3,000 GW and 1,100 GW of installed capacity respectively — both sit almost exactly at the global average for wind+solar share (~13.4%). They are adding renewables at massive absolute scale, yet in relative terms their grids remain firmly on the "dispatchable" side of the spectrum. Meanwhile, a smaller cluster of countries — Germany (~35%), Spain (~35%), and the UK (~33%) — have pushed past 30% wind+solar penetration, crossing into what this data classifies as "variable-heavy grids." These are systems that have already had to solve, at scale, the harder engineering and market-design problems that come with high shares of intermittent generation.
That gap matters more than it might first appear. Scale and maturity are two different axes of the energy transition, and conflating them leads to the wrong conclusions — a country can rank near the top in absolute renewable capacity while still being early in its transition curve, and vice versa. Australia is a good illustration of this: despite a mid-sized grid by global standards (~80 GW), it's the only non-European market to break into the variable-heavy zone, alongside a European group that includes Poland pushing up from the middle of the pack. On the other end, most Middle Eastern and several African producers — Kuwait, Iraq, Saudi Arabia, Oman, Qatar, Trinidad and Tobago — cluster tightly at low wind+solar shares, still largely dependent on fossil generation. And then there's Brazil: roughly 200 GW installed with a wind+solar share near the global average, a number that actually understates the country's renewable story, since hydropower — not captured on this particular axis — already carries the bulk of the grid.
For those of us working on renewable integration, the real takeaway isn't "install more GW." It's that crossing into variable-heavy territory changes the nature of the problem entirely — storage sizing, demand-side flexibility, transmission planning, and market/regulatory design all become first-order questions once wind and solar move past roughly a quarter of the mix. The countries that got there first didn't just build capacity; they built the operational and regulatory scaffolding to run a grid that isn't always dispatchable on command. As markets like Brazil and other emerging economies continue climbing that curve, the playbook written by early movers — particularly in Europe — is one of the most valuable assets available for getting there faster, and without repeating the stability mistakes made along the way.
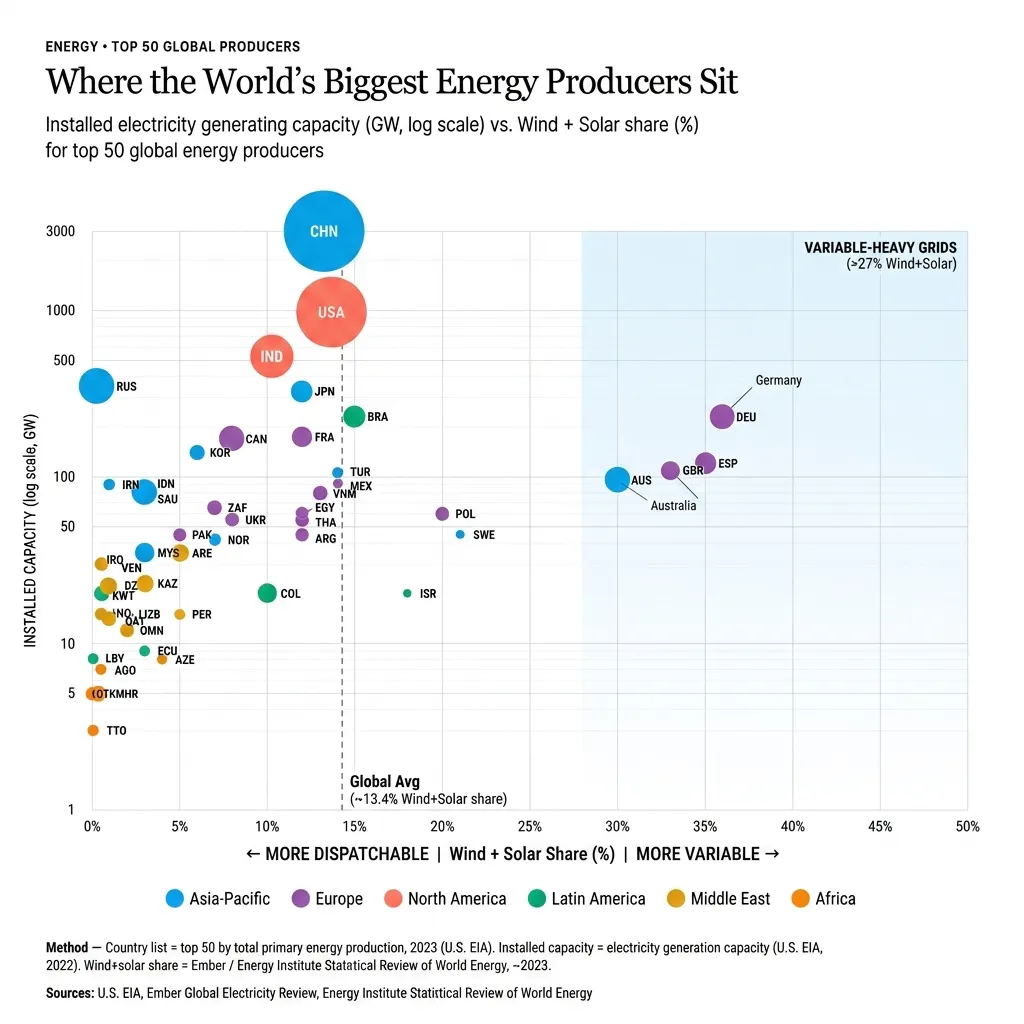
Source: U.S. EIA, Ember Global Electricity Review, Energy Institute Statistical Review of World Energy
What the chart shows: A scatter plot comparing the world's top 50 energy producers (2023), cross-referencing two variables:
Y-axis (logarithmic scale): installed electricity generating capacity (GW), 2022
X-axis: wind + solar share of the electricity mix (%)
Bubble size: proportional to installed capacity
Color: region (Asia-Pacific, Europe, North America, Latin America, Middle East, Africa)
Key insights:
China and the U.S. dominate in scale, but not in variability. China (~3,000 GW) and the U.S. (~1,100 GW) have the largest installed capacities in the world, yet both sit close to the global average wind+solar share (~13.4%) — meaning they grow renewables in absolute volume without necessarily leading in percentage share.
The "dividing line" sits at roughly 13–14%. The global average wind+solar share is marked by a vertical dashed line. To the right of it, the shaded blue zone (>27%) identifies "variable-heavy grids."
Europe leads in variable renewable penetration. Germany (~35%), Spain (~35%), the UK (~33%), and Poland all appear in the high-variability zone — mature markets with advanced wind and solar integration.
Australia stands out outside Europe as the only Asia-Pacific country in the "variable-heavy" zone (~30%), with moderate installed capacity (~80 GW).
Most oil/gas producers (Middle East, some African countries) cluster on the left, with very low variable renewable share (Kuwait, Iraq, Saudi Arabia, Oman, Qatar, Trinidad and Tobago) — reflecting energy mixes still dominated by fossil fuels.
Brazil is a notable regional highlight: ~200 GW installed capacity with a wind+solar share close to the global average — though this understates the country's true renewable penetration, since Brazil's grid is predominantly hydroelectric (not captured by this specific axis).
#EnergyTransition #RenewableEnergy #SolarEnergy #WindEnergy #EnergyMarket #GridResilience #EnergyStorage #CleanEnergy #SynergySolutions #ANEEL #IEA #IRENA