


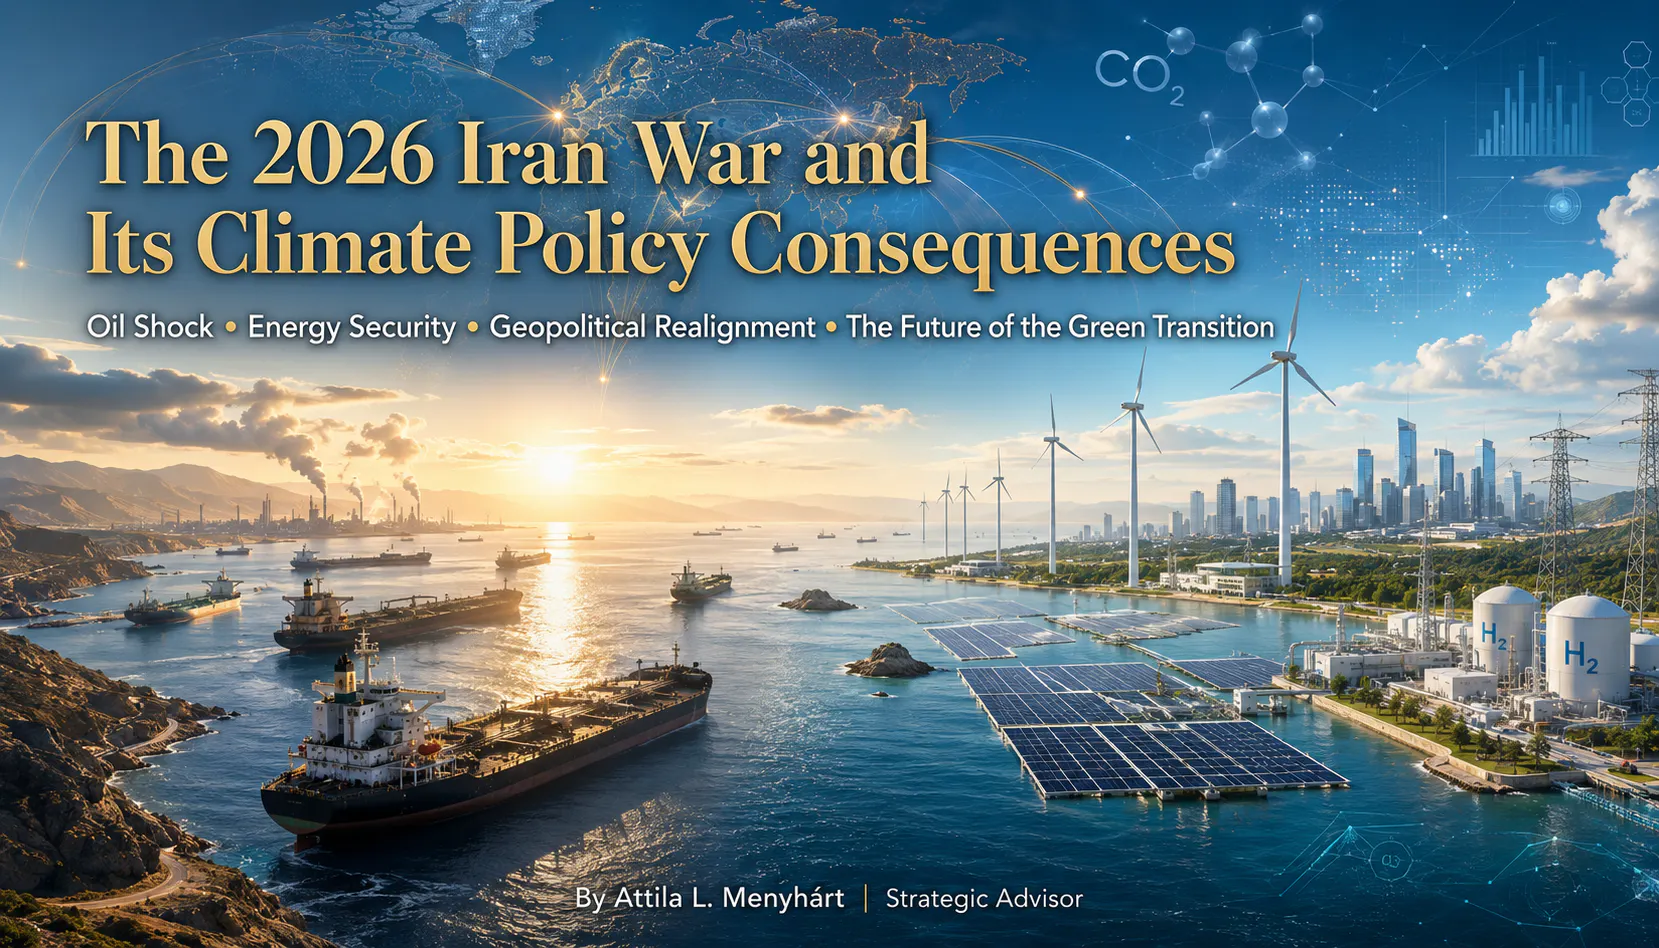
Oil Shock, Geopolitika Realignment, and the Future of the Green Transition
The largest oil supply disruption in history is reshaping climate politics — for better and for worse
What This Volume Is About
On February 28, 2026, US and Israeli strikes on Iranian nuclear sites triggered the biggest oil supply crisis in history. Iran shut the Strait of Hormuz — the narrow chokepoint through which one-fifth of the world's oil and gas flows. Within two weeks, oil prices jumped 55%, from $72 to nearly $120 a barrel. The IEA called it the 'greatest global energy security challenge ever seen.'
This final volume of the Geopolitics & Climate Change series asks a simple but consequential question: what does this war mean for the climate?
The answer is complicated. On one hand, the shock is accelerating the green transition — high oil prices make renewables more attractive, EV sales are surging, and the UNFCCC chief says the war is 'supercharging the global renewables boom.' On the other hand, governments are handing out fuel subsidies, reopening coal plants, and diverting money from climate finance to defence and energy relief. The green transition is being pushed forward and held back at the same time — by the same event.
The people paying the steepest price are those who had nothing to do with starting the war: poor countries in Africa and Asia that import oil, depend on fertilisers from the Gulf, and watch the climate finance they were promised evaporate under fiscal pressure. This is the central injustice of the 2026 energy crisis — and it is inseparable from the central injustice of the climate crisis itself.
A note on sources and method: this analysis distinguishes between what has happened (facts as of June 2026) and what may happen (scenarios through 2027). Where events remain in flux, we say so.
PART I The War: What Happened and Why It Matters for Energy
1. The War: What Happened and Why It Matters for Energy
1.1 How the Strait Got Shut
The roots of the 2026 conflict go back years. Iran had been steadily advancing its nuclear programme. The Trump administration's 'maximum pressure plus' policy cut off diplomatic channels. By early 2026, US and Israeli intelligence concluded that Iran was weeks away from a weapons-capable device.
On February 28, US and Israeli aircraft struck nuclear sites at Natanz, Fordow, and Isfahan, along with Revolutionary Guard command centres. Within hours, Iran's Supreme Leader made a decision that shook global energy markets: he ordered the closure of the Strait of Hormuz.
The Strait is just 21 miles wide at its narrowest point. But through it flows about 20% of the world's seaborne oil, plus enormous quantities of liquefied natural gas. When Iran mined the waterway, deployed fast-attack boats, and threatened tankers with missiles, roughly 200 oil tankers were effectively trapped in the Persian Gulf overnight.
The Gulf states — Saudi Arabia, the UAE, Kuwait, Qatar, Iraq — produce about 20% of the world's oil. Almost all of it exits through Hormuz. Iran's closure cut off that supply almost immediately. Qatar, the world's largest LNG exporter, declared force majeure on all its export contracts. Shell, BP, TotalEnergies, and Chevron all halted tanker transits within 48 hours.
Then Iran escalated further. It struck desalination plants across the Gulf — the source of over 80% of the region's fresh water. It targeted food import hubs. Gulf consumer food prices surged 40-120% within weeks. The World Food Programme warned that 45 million people globally could be pushed into acute food insecurity. This was no longer just an oil crisis. It was a full-scale economic weapon.
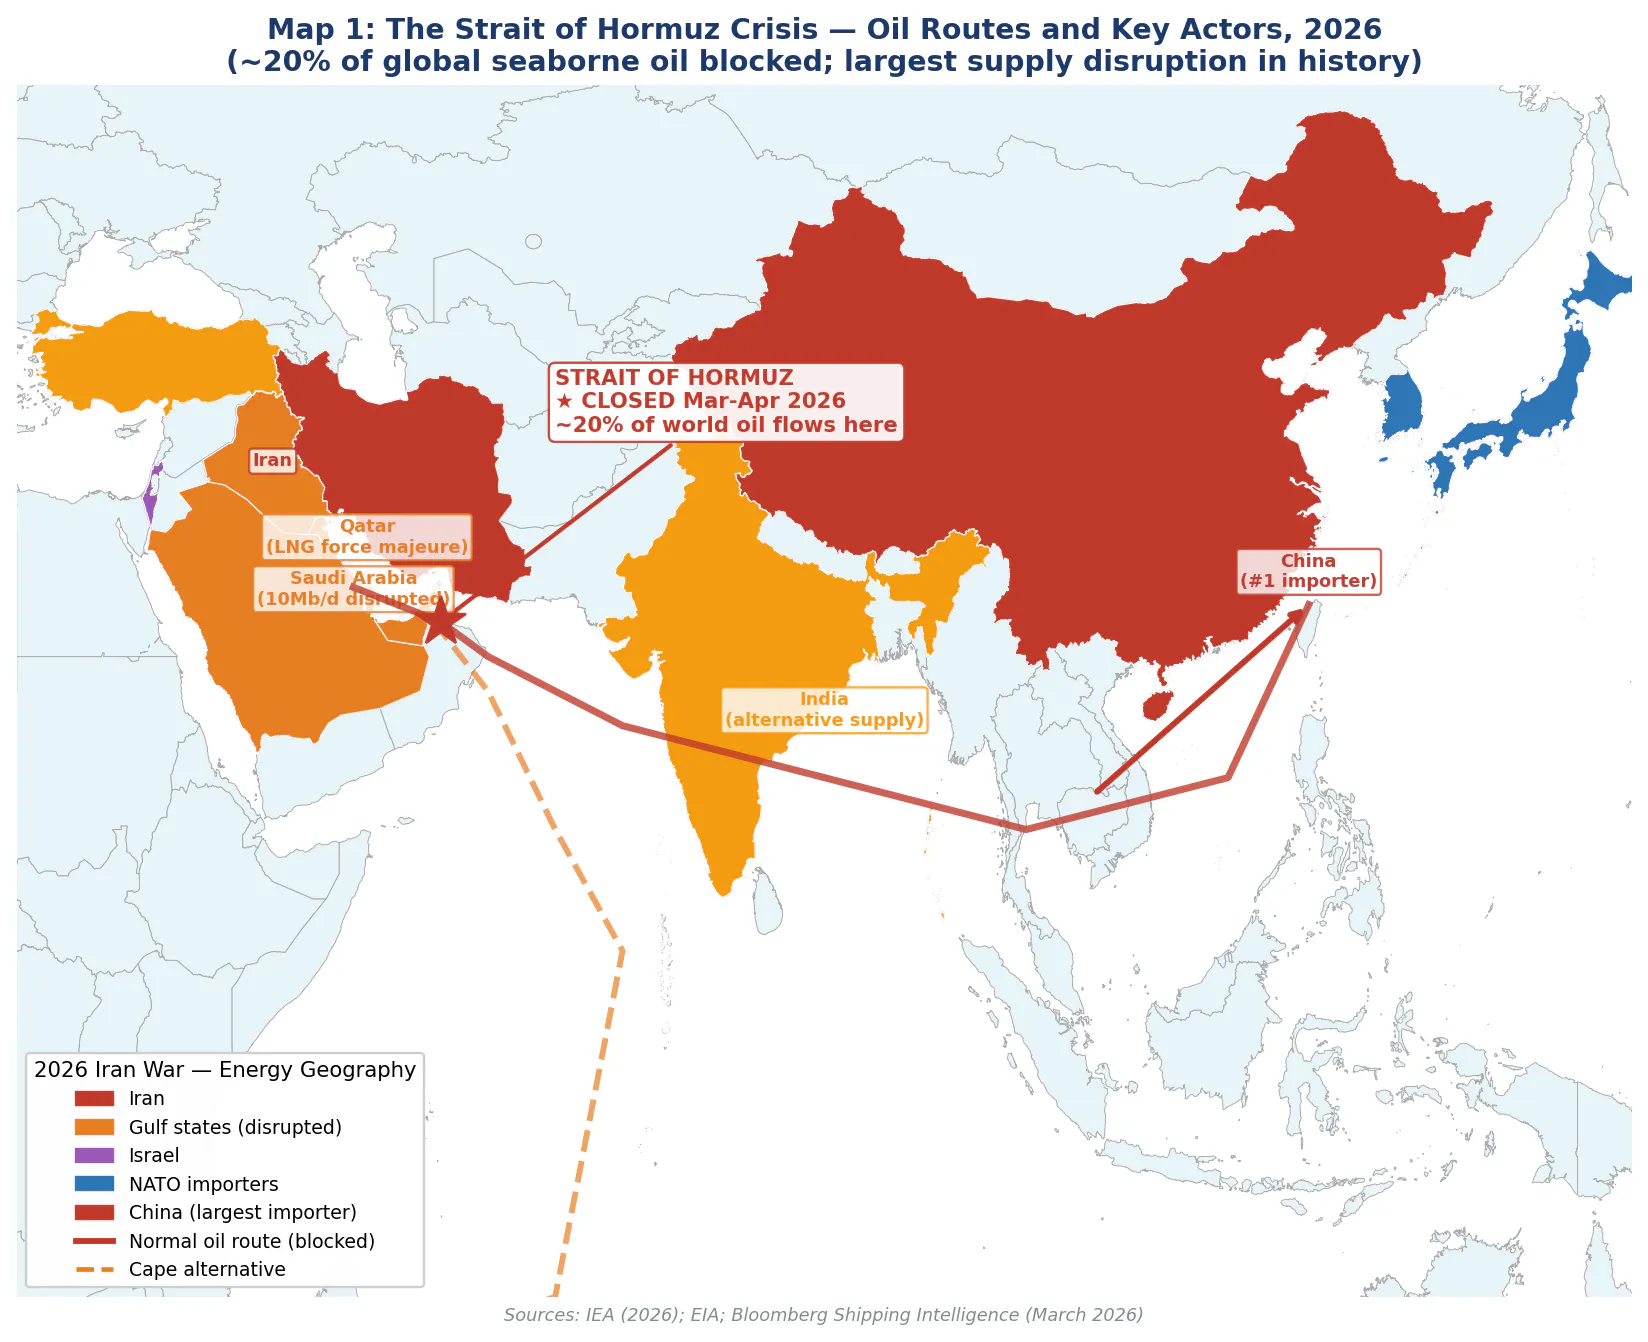
Map 1: The Strait of Hormuz Crisis — Oil Routes and Key Actors, 2026. Around 20% of the world's seaborne oil passes through the Strait. Iran's closure trapped 200 tankers and disrupted 10 million barrels per day of Gulf production. Sources: IEA (2026); EIA; Bloomberg Shipping Intelligence.
1.2 The Oil Price Rollercoaster
The day before the strikes, Brent crude was trading at $72.48. The morning after, it jumped 13% before markets even opened. By March 9, as GCC production cuts were confirmed and Iranian oil facilities were struck for the first time, Brent hit $120. That is a 55% increase in less than two weeks. March 2026 recorded a 51% monthly price increase one of the largest single-month moves in the history of the benchmark.
What followed was a rollercoaster driven entirely by diplomatic signals. Each time Trump suggested talks were progressing, oil dropped $10-20 in a day. Each setback sent it back up. The SEC and CFTC opened investigations into three separate clusters of suspicious oil futures trading that appeared to precede diplomatic announcements the markets moved so fast and so precisely that regulators concluded some participants had advance information.
By late May, a partial ceasefire and the gradual reopening of the Strait brought Brent back to around $92-93 down from the peak but still nearly 30% above where it started. Energy analysts broadly agreed: even if the Strait stays open, lingering infrastructure damage, security risk premiums, and market uncertainty would keep oil above $80 for the rest of 2026. The World Bank projected Brent averaging $115 for the year if disruptions continued.
IEA Director Fatih Birol put it plainly: 'This is the biggest energy crisis in history.' Not just the biggest price spike. The biggest crisis because of the combination of scale, speed, and geographic scope of the disruption.
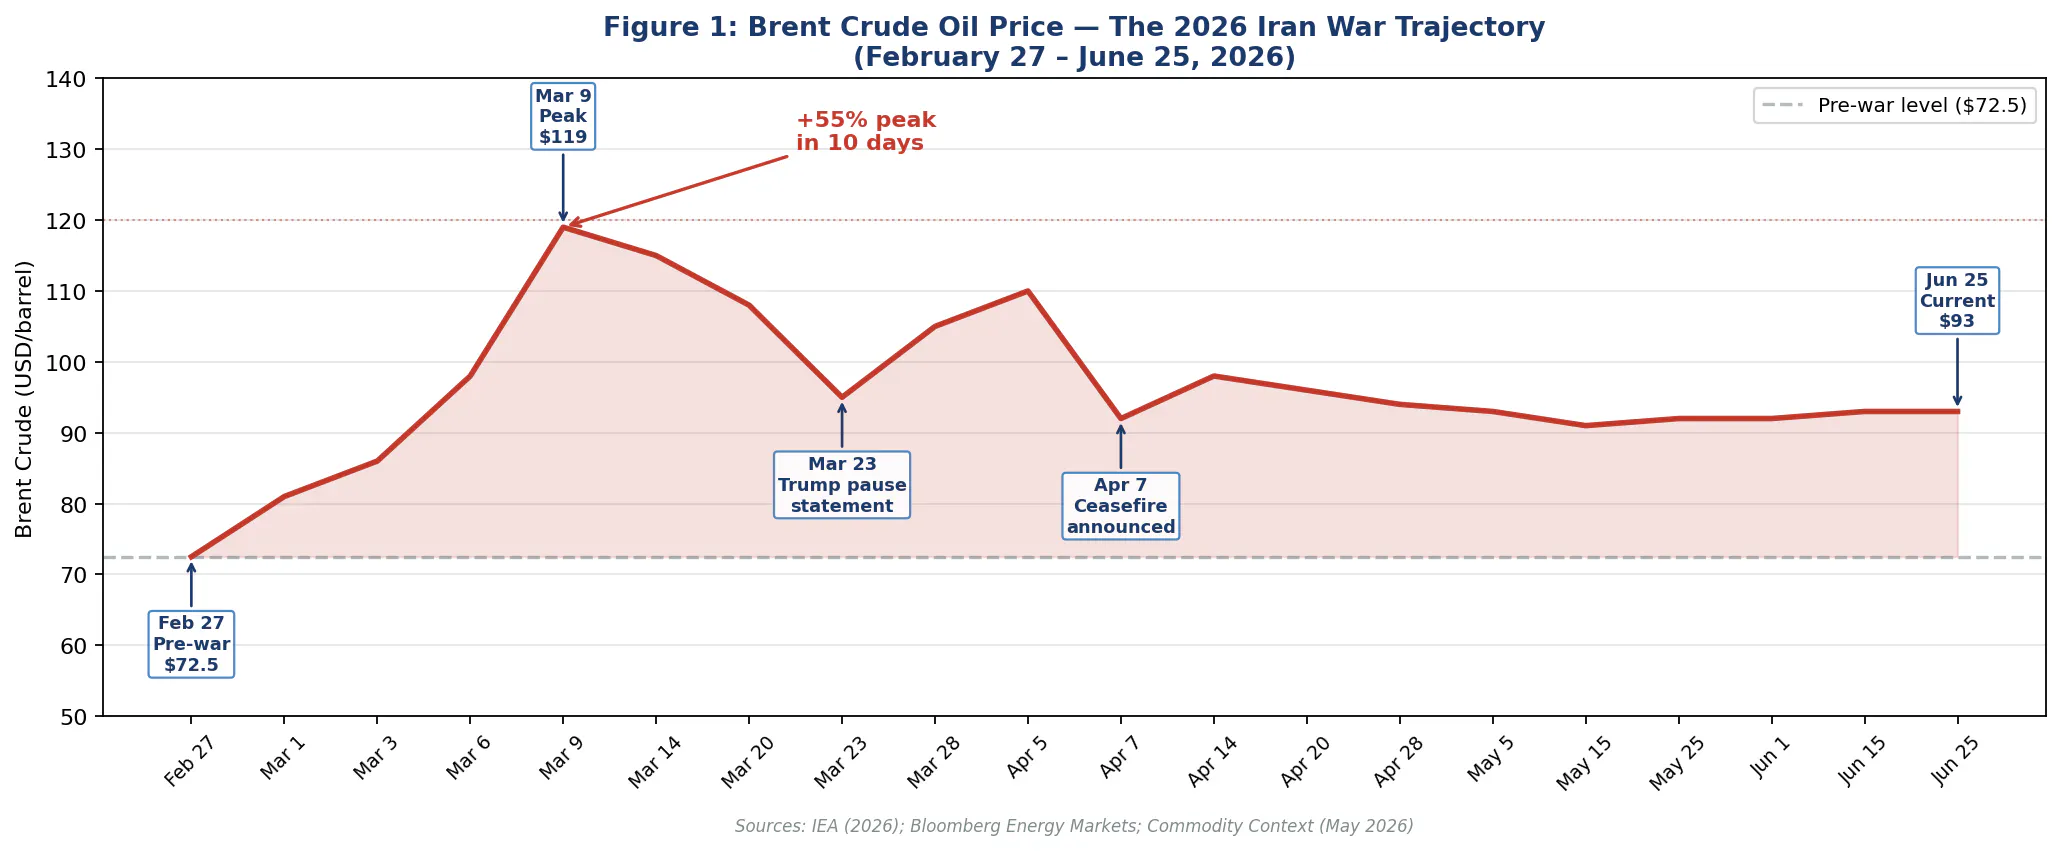
Figure 1: Brent Crude Oil Price — The 2026 Iran War Trajectory (February 27 – June 25, 2026). From $72.5 pre-war to a peak of $119, then back to $93 after the partial ceasefire — one of the most volatile oil price episodes in history. Sources: IEA (2026); Bloomberg Energy Markets; Commodity Context (May 2026)
PART II How the Shock Hit the Global Economy
2. How the Shock Hit the Global Economy
2.1 Five Ways the Pain Spread
An oil price shock doesn't just make petrol more expensive. It travels through the global economy in multiple ways simultaneously — some obvious, some invisible until they show up in grocery bills or government budgets months later.
The most direct hit was energy costs. In the United States, petrol crossed $4 a gallon nationally and approached $9 in California. Germany saw pump prices rise 30%. Japan — which gets 94% of its oil from the Middle East — immediately released 80 million barrels from strategic reserves. Across Europe, Asia, and Latin America, governments scrambled to implement fuel subsidies and tax cuts to keep social peace.
The second hit came through food. Fertiliser production costs are roughly 70% energy. When oil and gas prices surge, fertiliser prices surge too — urea was up 60% by mid-March. Higher fertiliser costs mean higher food prices, with a lag of several months. For Pakistan, Bangladesh, East Africa, and dozens of other food-importing developing countries, the combination of fuel and food inflation created what the World Bank diplomatically called 'recession-like conditions.'
The third channel was financial markets. When the Middle East goes to war, investors flee to the safety of the US dollar. A stronger dollar sounds fine — unless you're a developing country that borrowed in dollars. Dollar-denominated debt becomes more expensive to service. Countries already struggling with debt — many of which we analysed in Volume 3 — suddenly found their repayment costs rising at the same moment as their import bills.
Supply chains took the fourth hit. Petrochemicals, electronics components, even helium for semiconductor manufacturing — all depend on Gulf supplies or pass through Hormuz. Airlines in Southeast Asia and Oceania cancelled routes or added surcharges. The automotive industry faced component shortages on top of existing critical mineral supply chain pressures.
The fifth and subtlest channel was investment confidence. When the future is genuinely uncertain, companies freeze long-cycle decisions. The clean energy projects — wind farms, solar arrays, battery factories — that require ten-year revenue forecasts faced a difficult two months in March and April as corporate treasury departments simply stopped committing capital.
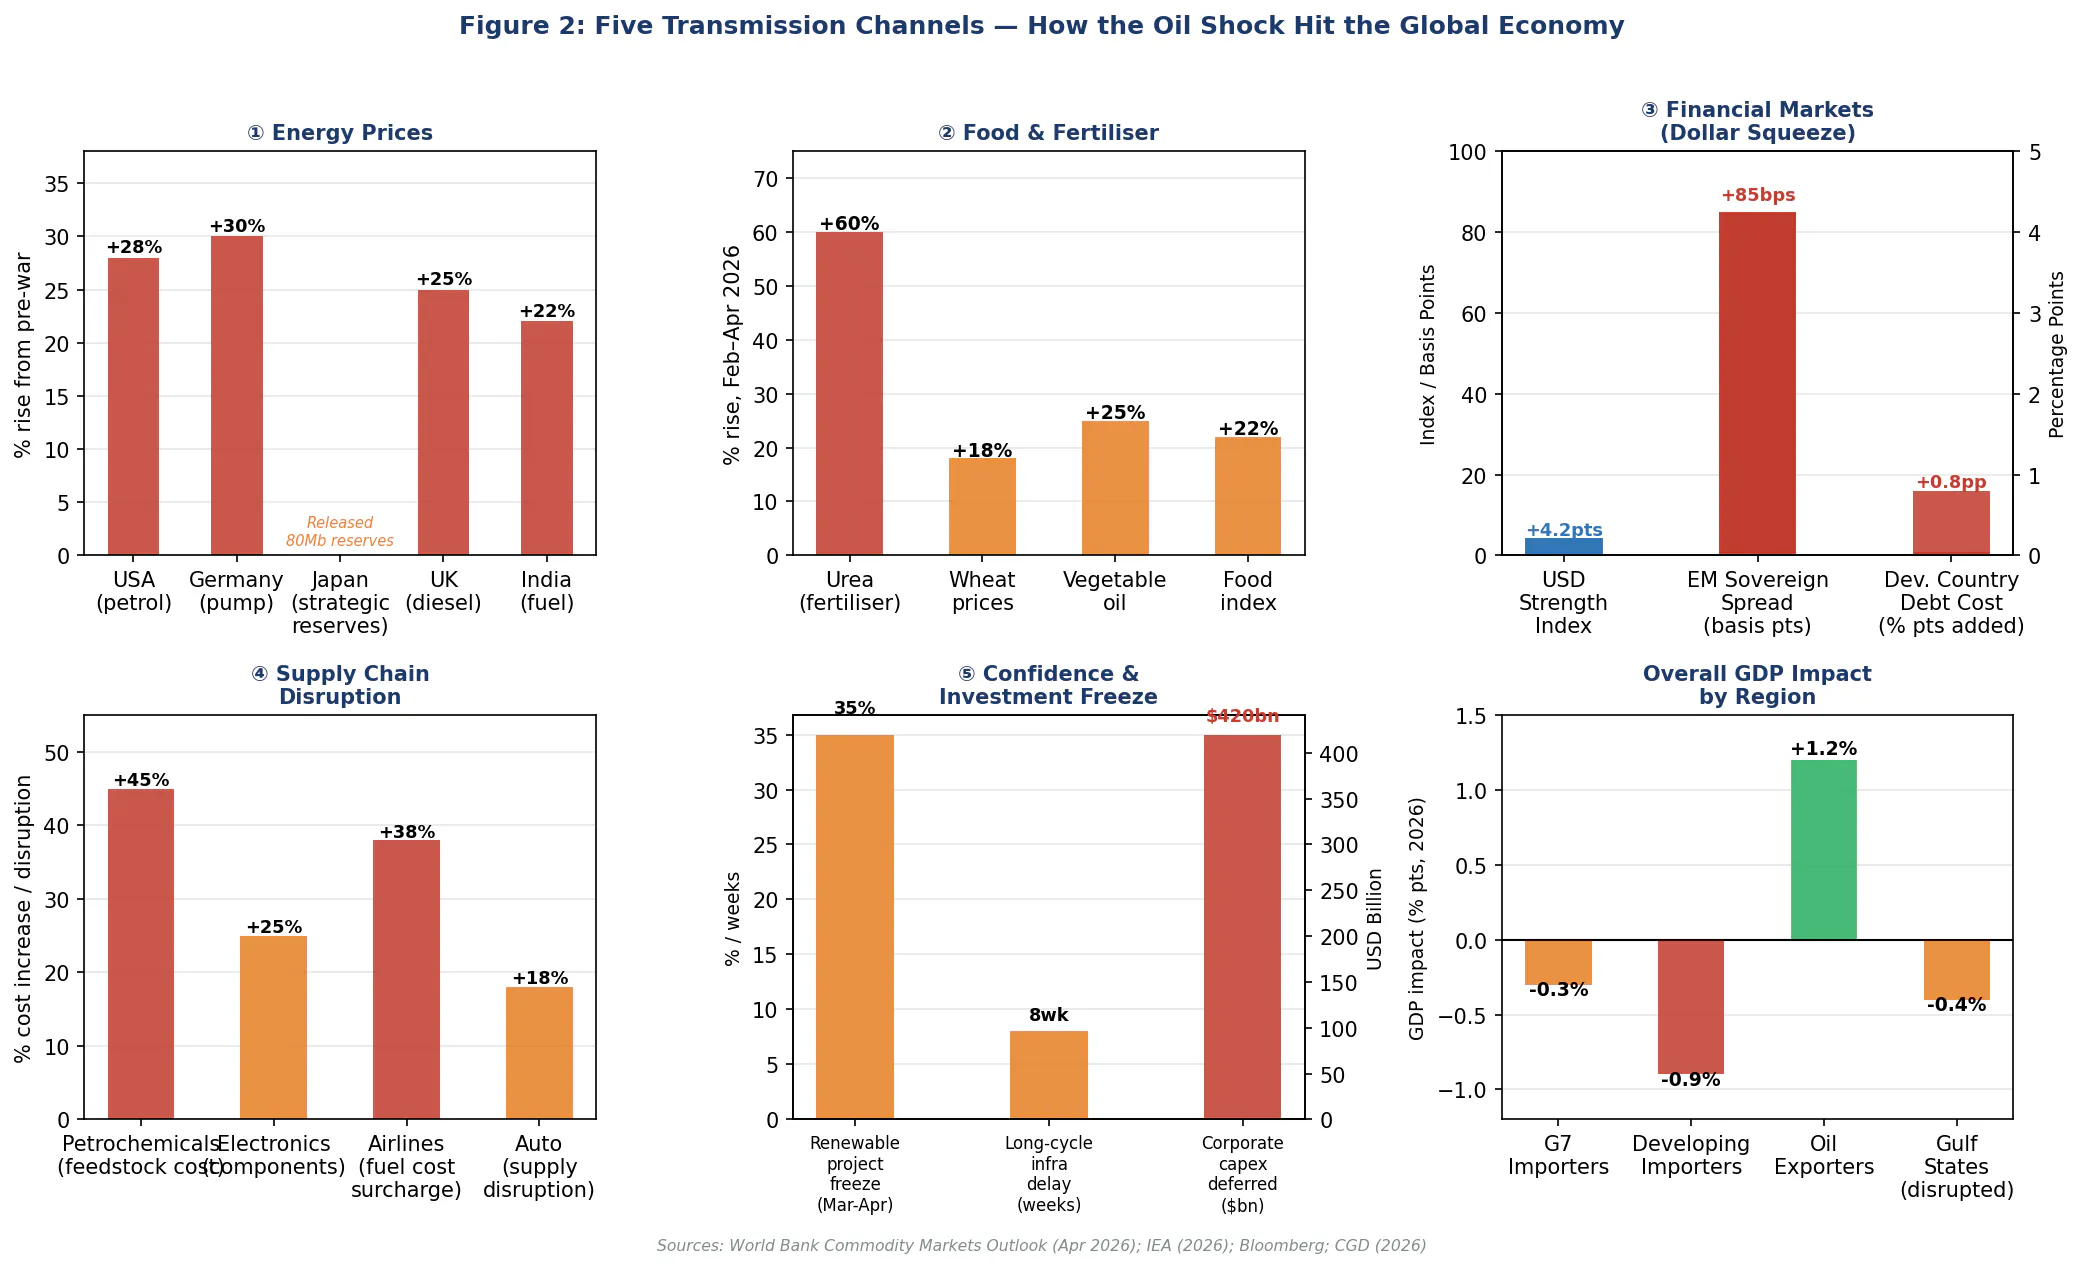
Figure 2: Five Transmission Channels — How the Oil Shock Hit the Global Economy. Energy, food, financial, coal regression, and supply chain channels each produced distinct impacts. Sources: World Bank (Apr 2026); IEA (2026); Bloomberg; CGD (2026)
2.2 The Paradox: Subsidising Fossil Fuels While Accelerating Clean Energy
Here is the central paradox of the 2026 oil shock: the same event that made the strongest-ever economic case for the green transition also created the conditions that most constrained it.
The acceleration case is real. When oil is at $120, solar and wind look even more attractive. Electric vehicles suddenly save their owners serious money. Governments that had been arguing about whether to accelerate the transition found the argument made for them by the market. In the US, March 2026 was the first month renewables generated more electricity than natural gas. UK rooftop solar installations hit a record 27,000 in a single month. UNFCCC chief Simon Stiell said it directly: 'Those who've fought to keep the world hooked on fossil fuels are inadvertently supercharging the global renewables boom.'
But simultaneously — the same governments were cutting fuel taxes, reinstating diesel subsidies, and keeping coal plants running. Germany suspended €1.6 billion in fuel levies. Brazil spent $575 million a month on diesel subsidies. Japan increased coal generation by 10% in April-May. Pakistan's coal consumption jumped 27% as LNG became unavailable.
The problem is that both things are happening at once, but not equally everywhere. Rich countries can do both — subsidise fuel costs now and invest in renewables for the long term. Their fiscal capacity allows it. Poor countries cannot. They face a forced choice: use limited government money to keep fuel affordable and social peace intact, or invest in the clean energy transition. Under fiscal pressure, the immediate crisis always wins. The green transition gets postponed.
This is not a failure of political will. It is a structural consequence of inequality. Countries with fiscal space get to choose the future. Countries without it are trapped in the present.
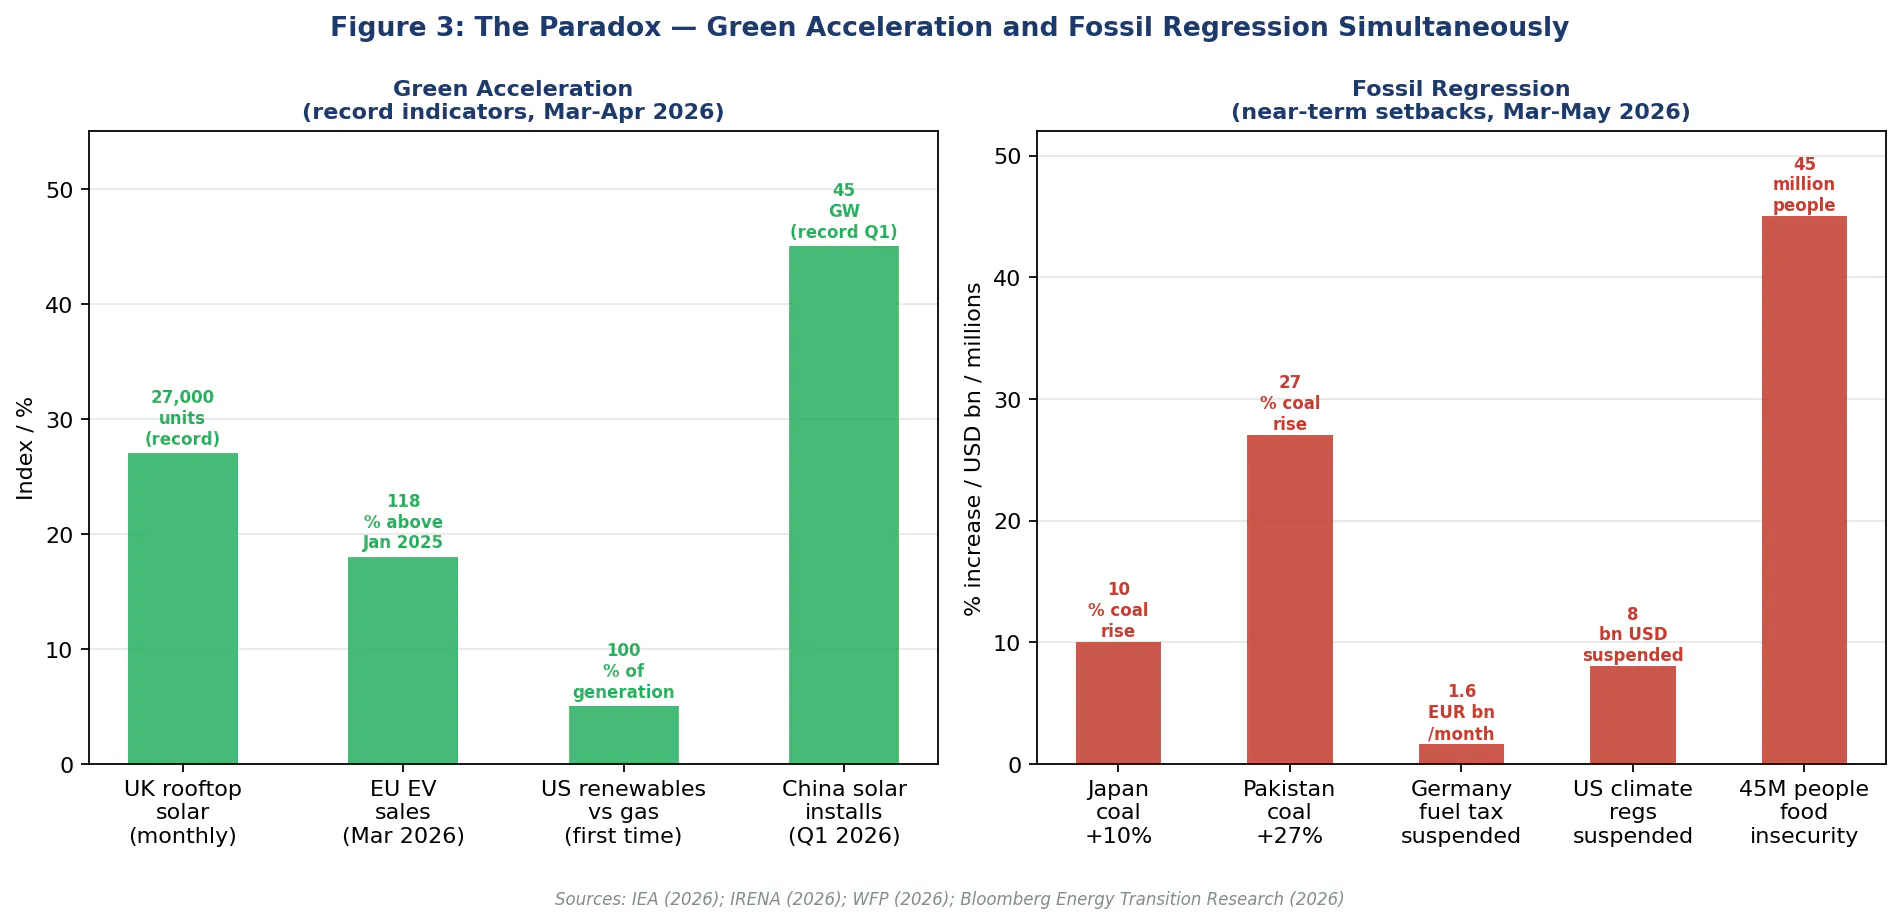
Figure 3: The Paradox — Green Acceleration and Fossil Regression Simultaneously. Record UK solar, US renewables milestone, and China green build vs. coal surges in Japan, Pakistan, and Indonesia. Sources: IEA (2026); IRENA (2026); WFP (2026)
PART III What This Means for Climate Policy
3. What This Means for Climate Policy
3.1 COP31 Antalya: The Summit That Changed Before It Began
COP31 is scheduled for November 2026 in Antalya, Turkey. It was supposed to be the summit that moved from the financial commitments of COP29 to concrete implementation. Instead, it is taking place in the shadow of the largest energy crisis in history — hosted by a country that is itself directly affected by the Strait of Hormuz disruption, and co-presided by Australia, which had planned to centre the summit on Pacific island vulnerability.
The war has reshaped the COP31 agenda in four ways that were not anticipated when the summit was planned.
First, the fossil fuel debate is no longer abstract. Before the war, developed country delegations could argue about fossil fuel phaseout timelines in theoretical terms. Now there is live evidence — playing out in real time — of exactly what fossil fuel dependency costs: $120 oil, stranded tankers, desalination plant strikes, food price spikes, and geopolitical leverage in the hands of authoritarian states. The energy security argument for the transition has never been more concrete.
Second, military emissions are suddenly on the agenda. The SETA Foundation calculated that the Iran war produced an estimated 4.77 million tonnes of CO₂ equivalent in its first two weeks — from building destruction, oil facility fires, and military operations. Under current UNFCCC reporting frameworks — which exclude military emissions entirely — none of this counts toward any national greenhouse gas inventory. Military emissions are entirely excluded from national reporting obligations. This exclusion, which was originally justified on data availability grounds, now looks indefensible. COP31 is likely to see the first serious push for a framework to account for conflict-driven climate costs.
Third, climate finance credibility is at its lowest point since Copenhagen. The governments that committed to the NCQG's $300 billion by 2035 are the same governments now spending hundreds of billions on fuel subsidies and energy relief. For Global South negotiators, this contradiction is not abstract — it is their countries' climate adaptation budgets being squeezed by the same fiscal pressures.
Fourth, Turkey's role as host adds geopolitical complexity. Turkey is a NATO member directly affected by the Hormuz disruption — dependent on Gulf energy and food imports, managing the humanitarian consequences of regional instability on its southern border. Antalya is a city on the Mediterranean. The irony of hosting a climate summit in a country experiencing the full force of a fossil fuel supply crisis is not lost on anyone. Turkey's energy vulnerability is not abstract — it is structural. The Akkuyu Nuclear Power Plant, under construction on Turkey's Mediterranean coast under a Russian Build-Own-Operate (BOO) model, represents a multi-decade strategic dependency on Russian nuclear technology and fuel supply, even as Turkey simultaneously navigates NATO membership and participation in Ukraine-related sanctions regimes. The Gulf crisis has added a second layer of energy exposure: Turkey's gas imports from Azerbaijan's Shah Deniz field, and its role as a transit hub for the EastMed gas corridor, place it at the intersection of multiple supply disruption vectors simultaneously. BOTAŞ, Turkey's state gas distributor, has been managing deferred payment arrangements with Gulf LNG suppliers since March 2026 — a quiet indicator of the fiscal stress that the Hormuz disruption is placing on the COP31 host country's energy budget. For Turkey, hosting COP31 Antalya is not merely a diplomatic opportunity; it is a moment when the entire fossil fuel dependency argument of the last thirty years is playing out in its own national energy accounts.
3.2 Green Investment: Racing Ahead in the North, Falling Behind in the South
New IRENA data released in May 2026 confirmed something important: in most regions of the world, building new solar and wind is now cheaper than running existing coal and gas. The cost crossover has happened. The economics of the transition are essentially self-executing — in markets where capital is available and policy frameworks are stable.
That qualification matters enormously. In Europe and North America, the Iran war has accelerated clean energy investment. High energy prices make the business case for renewables undeniable. EV sales enquiries hit records across European and US markets in March and April. The EU drafted plans to cut electricity taxes and speed up clean energy permits — explicitly framing it as both an energy security measure and a climate win.
In much of Asia and the Global South, the story is different. Bangladesh and Pakistan — both making serious progress on solar deployment before the war — are now diverting government resources to manage fuel and food crises. Several countries that had been phasing out coal are extending plant lives. Japan increased coal generation. Indonesia tightened LNG imports and turned back to domestic coal.
The critical minerals angle — central to Volume 4's analysis — has sharpened. The Iran war has made Western governments more determined to secure clean energy supply chains that are not vulnerable to Middle East disruptions. This increases the political urgency of the critical mineral governance agenda we documented in Volume 4. But it does not increase the fiscal capacity of African and Latin American mineral producers to develop domestic processing industries — if anything, the macroeconomic shock has made that harder.
The clean energy transition is not slowing down globally. It is accelerating — but unevenly. The gap between countries that can afford to transition fast and those that cannot is getting wider.
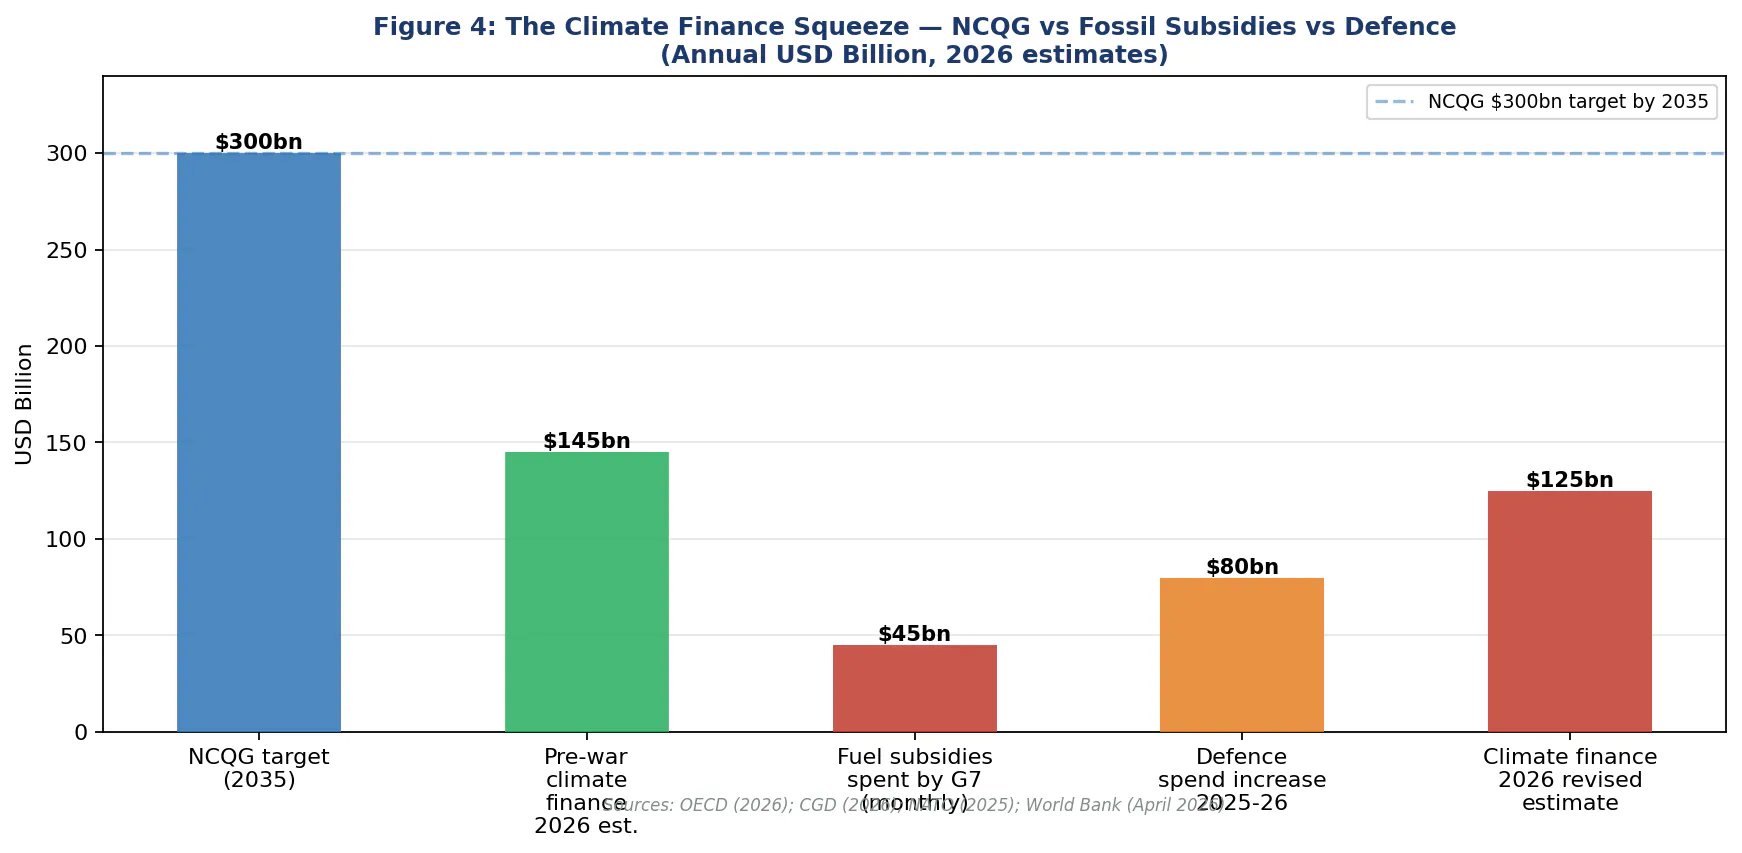
Figure 4: The Climate Finance Squeeze — NCQG vs Fossil Subsidies vs Defence (Annual USD Billion, 2026). G7 governments spending $45bn/month on fuel subsidies while the NCQG $300bn target shrinks under fiscal pressure. Sources: OECD (2026); CGD (2026); World Bank (April 2026)
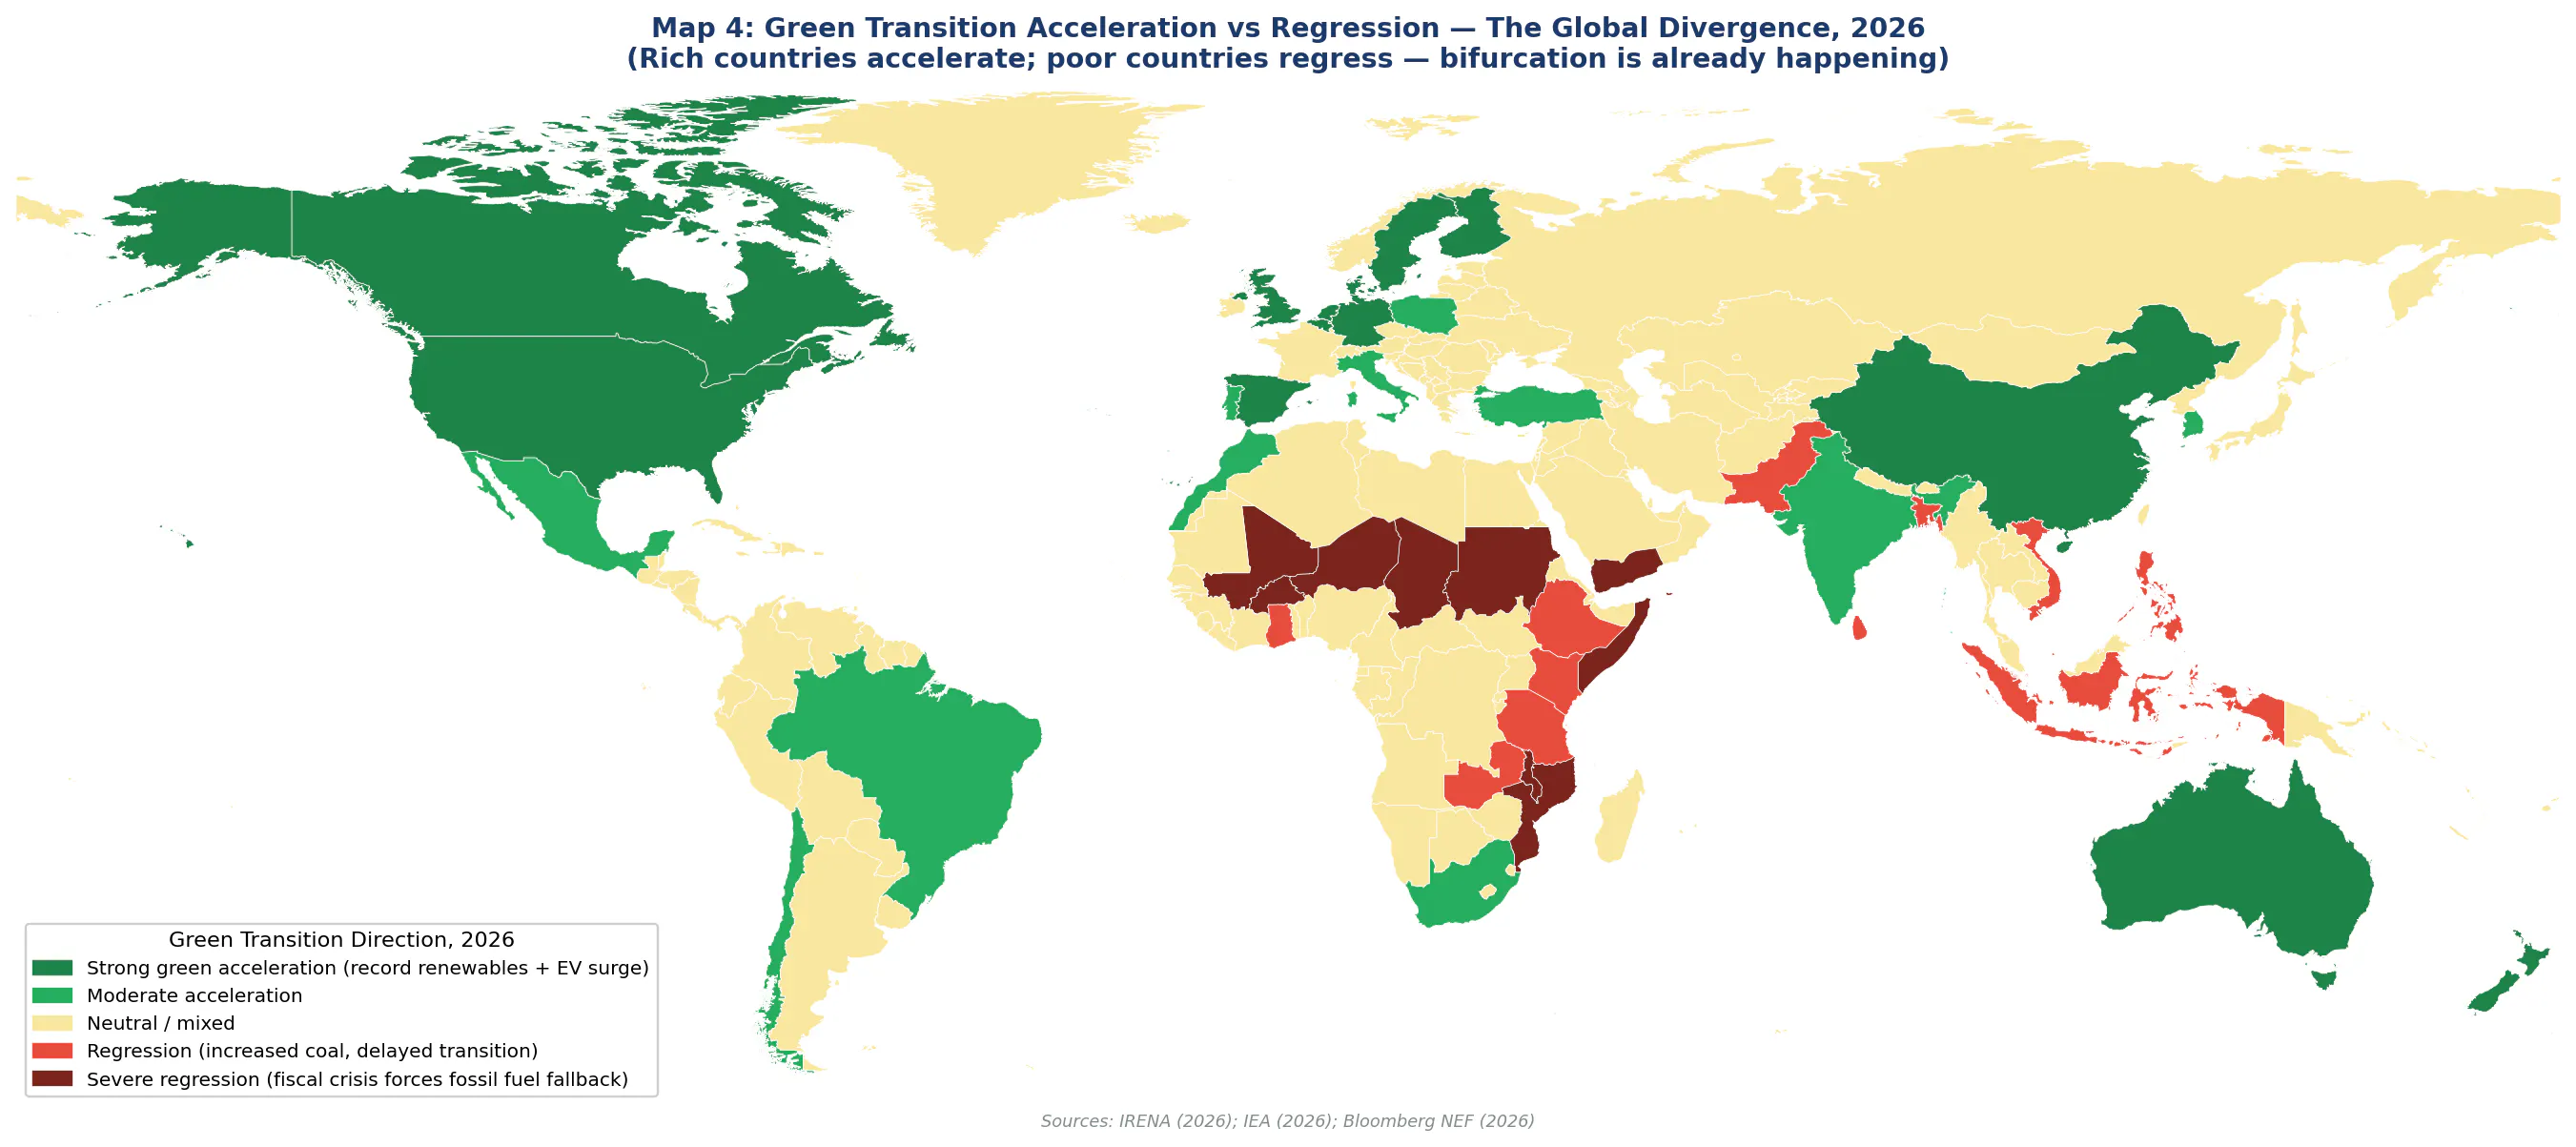
Map 4: Green Transition Acceleration vs Regression — The Global Divergence, 2026. Rich countries accelerate the transition; poor countries are pushed back toward fossil fuels by fiscal constraints. Sources: IRENA (2026); IEA (2026); Bloomberg NEF (2026)
3.3 Military Emissions: The Climate Cost Nobody Counts
Wars emit carbon. This is obvious and also completely absent from international climate accounting.
The SETA Foundation calculated that the first two weeks of the Iran war produced approximately 4.77 million tonnes of CO₂ equivalent: 2.4 million tonnes from building and infrastructure destruction, 1.88 million tonnes from oil facility and tanker fires, and 529,000 tonnes from military operations themselves. These figures do not include the extra shipping emissions from tankers rerouting around the Cape of Good Hope — adding 3,500 nautical miles to the Asia-Europe journey — or the additional coal emissions from countries that switched away from disrupted LNG supplies.
Under the 1996 IPCC guidelines that still govern national greenhouse gas reporting, military emissions are explicitly excluded. The reasoning was originally practical — wartime data is hard to collect, and national security information is sensitive. But that justification has worn thin. We now have satellite monitoring, third-party estimation methodologies, and a climate emergency that makes every tonne of unaccounted CO₂ matter.
COP31 in Antalya could be the moment this changes. Turkey — directly affected by the war — and Australia as co-president have both signalled interest in a Climate and Conflict Working Group that would develop a methodology for measuring and reporting conflict-driven emissions. It would be a small but significant step: acknowledging that the climate cost of war is real, even when it is invisible in national inventories.
PART IV Geopolitical Winners, Losers, and New Alignments
4. Geopolitical Winners, Losers, and New Alignments
4.1 Who Is Winning? (And the Complicated Answer)
At first glance, the 2026 Iran war has a clear winner: the United States. By April 24, US crude and petroleum product exports hit nearly 12.9 million barrels per day — a record. American energy companies are posting windfall profits. The Trump administration described $120 oil as 'a small price to pay.' For a country that is a net energy exporter, high oil prices are mostly good news — at the industry level. But the picture is more complicated for consumers. US Gulf Coast refineries are calibrated for heavy crude from Venezuela and Mexico rather than the light tight oil produced domestically, so US pump prices still carry import-driven cost pressures even as domestic production surges. Gasoline at $9 per gallon in California is a real political liability — which explains why the US long-term benefit score in Figure 6 falls back to +1 from its short-term +3: the windfall goes to producers; the inflationary pain is distributed across 330 million households.
Russia also benefits, paradoxically. Excluded from Western markets by Ukraine sanctions, Russian oil flows to China and India. Both are now scrambling to replace Gulf supply from wherever they can find it — including Russia, at prices that give Moscow useful revenue and leverage.
Saudi Arabia, the UAE, and Qatar are in a more complicated position. Yes, the oil they can export commands higher prices. But the conflict has damaged their production and export infrastructure, and their domestic stability depends on food and water imports that were disrupted by the same conflict. Aramco reported drone strikes on refinery infrastructure. QatarEnergy's force majeure on LNG contracts was not a voluntary commercial decision. The long-term damage to Gulf energy infrastructure could take years to repair and billions to fix.
Iran itself is in an ambiguous position. It inflicted real economic pain on the Gulf states and significant disruption to global markets. But its own oil export revenues — already constrained by sanctions — are further reduced by the conflict. The economic cost of the war on ordinary Iranians is severe. And the appointment of Mojtaba Khamenei as Supreme Leader — closer to the IRGC hardliners than to pragmatic reformers — makes a durable settlement harder to achieve.
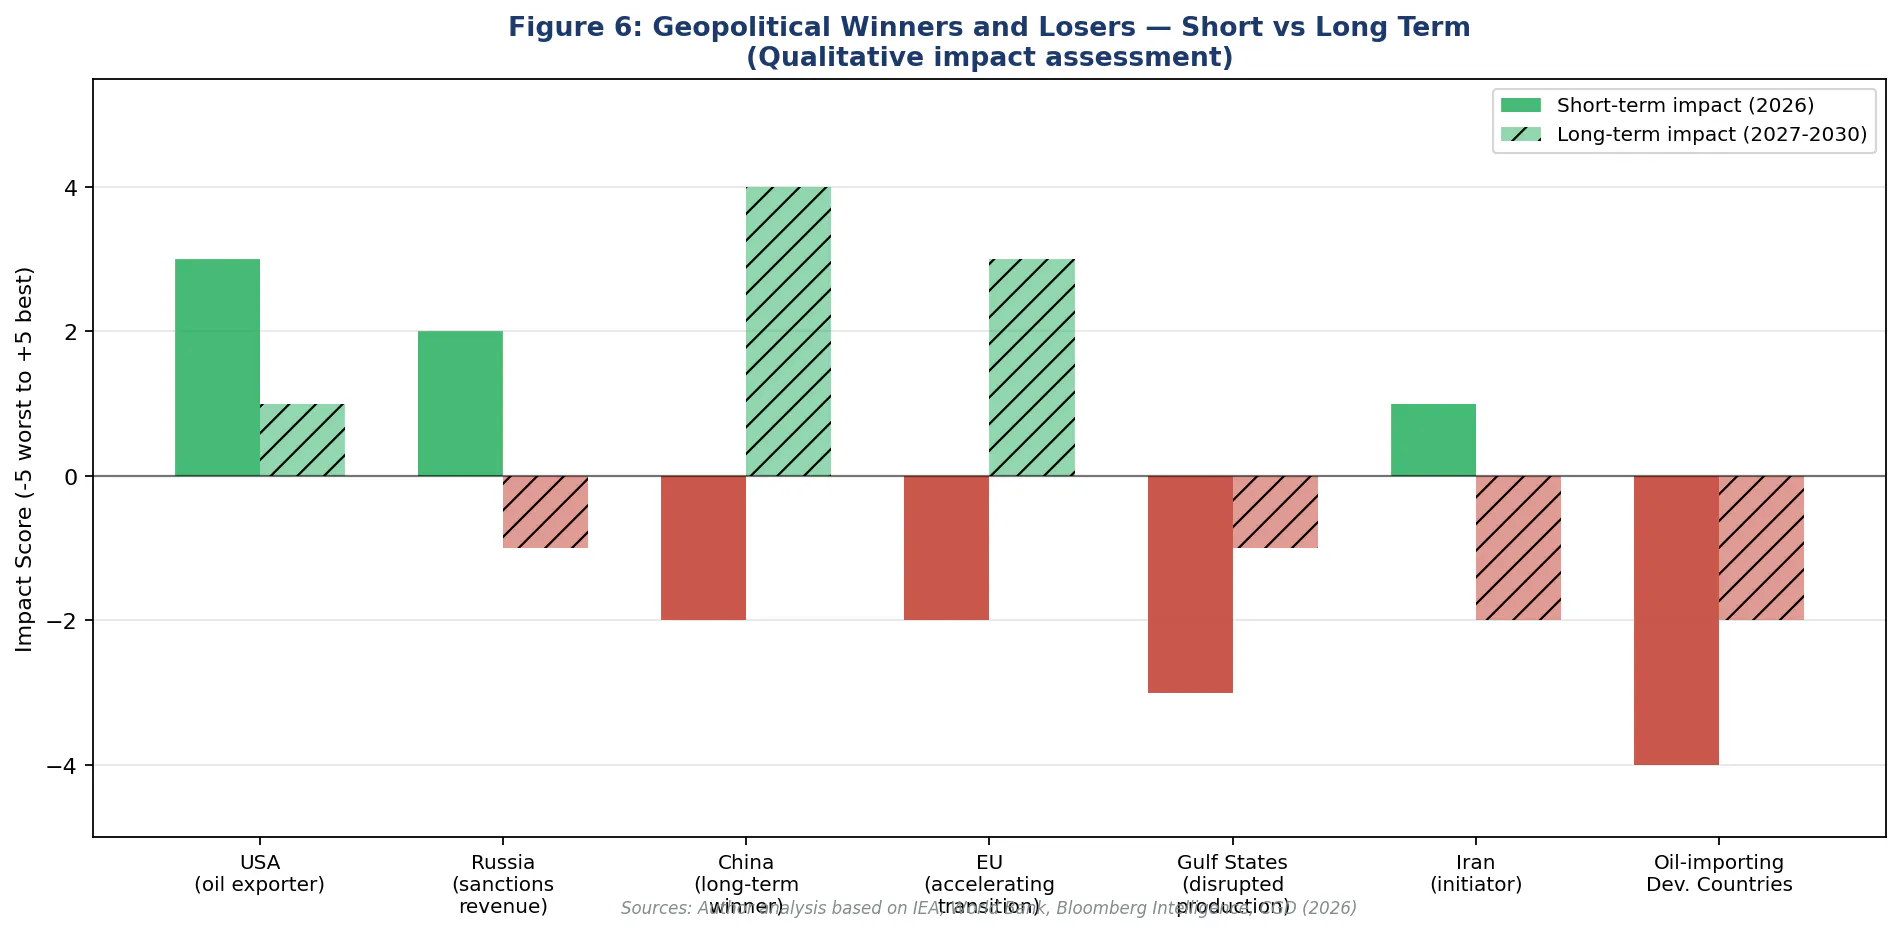
Figure 6: Geopolitical Winners and Losers — Short vs Long Term. The US wins short-term; China wins long-term through clean energy dominance; oil-importing developing countries lose in both timeframes. Sources: IEA, World Bank, Bloomberg Intelligence, CGD (2026)
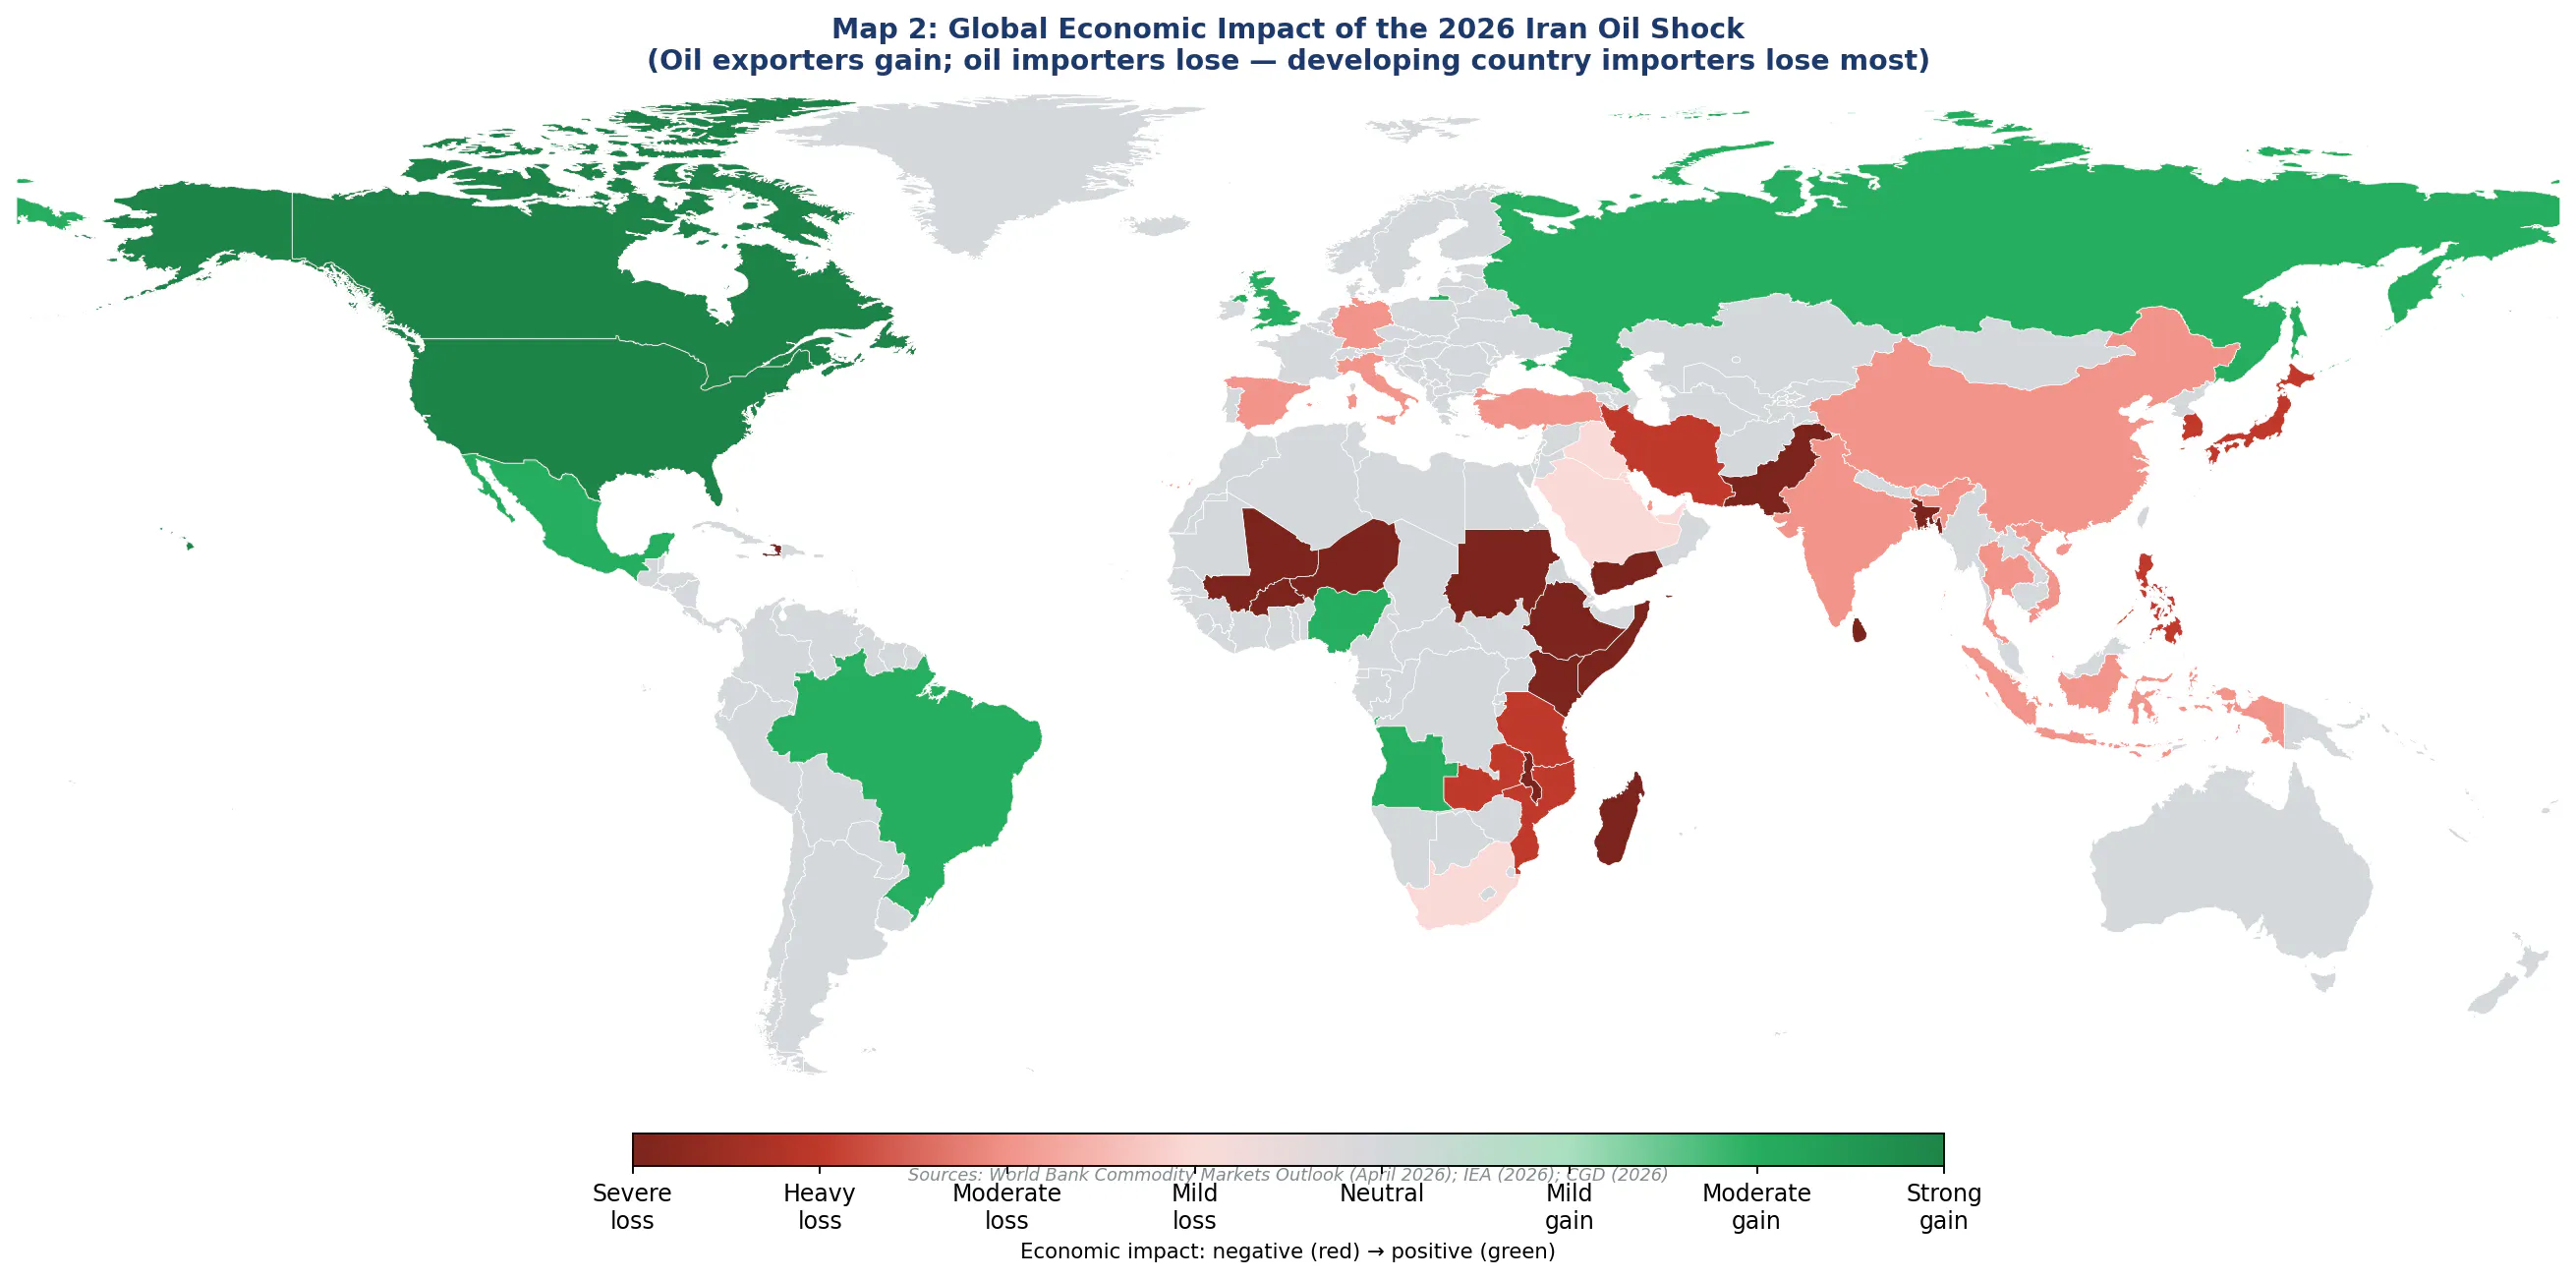
Map 2: Global Economic Impact of the 2026 Iran Oil Shock. Oil exporters (green) gain; oil importers (red) lose — with the most severe impacts on developing country importers in Asia, Africa, and the Caribbean. Sources: World Bank (Apr 2026); IEA (2026); CGD (2026)
4.2 China: Biggest Loser of the Shock, Biggest Winner of the Transition
China's position in the 2026 energy crisis is the most strategically interesting of any major power.
In the short term, China loses. About 70% of Hormuz oil flows go to China, India, Japan, and South Korea. China is the world's largest oil importer. The supply disruption hits it hard. China drew down strategic reserves rather than buying at peak prices — a disciplined move that limited the damage but could not eliminate it.
In the medium and long term, China wins — and wins decisively. China is the world's dominant manufacturer of solar panels, wind turbines, electric vehicles, and batteries. Every government in the world that decides to accelerate its energy independence through renewables is buying Chinese equipment. The Iran war has added a national security argument to the economic argument for solar and wind — and that increases demand for precisely what China makes.
China is also accelerating domestically. 2026 is on track to be the year renewable generation definitively exceeds coal in Chinese annual output. Chinese EV adoption is at record levels. China has moved faster than any other major economy to insulate itself from fossil fuel supply shocks — and it is doing so using technologies it manufactures itself.
The critical minerals connection is important here. As we documented in Volume 4, China dominates the processing of most critical minerals required for the green transition. The Iran war is making Western governments more anxious about supply chain security — but it has not changed the fact that Chinese processing dominance is structural, not temporary. If anything, China's strategic conviction that energy independence through renewables is a national security priority is likely to deepen its investment in the full critical minerals supply chain.
4.3 The EU: This Time, Getting It Right
The EU's response to the 2026 Iran war is meaningfully different from its response to the 2022 Russia energy crisis — and the difference matters for climate policy.
In 2022, the EU's emergency response included a rush to lock in LNG supplies from the US and Qatar, building new regasification terminals and signing long-term contracts. That was understandable under the circumstances, but it locked in fossil fuel infrastructure that complicated the transition.
In 2026, the EU's response is more directly aligned with clean energy acceleration. The Commission proposed cutting electricity taxes below gas and oil taxes, allowing faster permits for renewable projects, and promoting smart grids and energy storage. The framing is explicit: this is both energy security policy and climate policy, simultaneously.
Why the difference? Several reasons. European renewable costs have fallen dramatically since 2022 — solar and wind are now clearly cheaper than fossil fuels in most contexts. EV adoption has reached the point where electrification of transport is a credible near-term demand response to oil price spikes. And European policymakers have genuinely learned from 2022: the answer to fossil fuel supply disruption is not more fossil fuel infrastructure. It is less dependence on fossil fuels.
The CBAM complication: as we analysed in Volume 3, the Carbon Border Adjustment Mechanism entered its full phase in January 2026. With fertiliser prices up 60% and steel and aluminium at record highs due to the Gulf supply disruption, CBAM's carbon charges are landing on top of already-elevated commodity prices. For Global South exporters, this is a double hit — and it is sharpening the 'green protectionism' critique that we documented in detail in Volume 3.
PART V The Global South Double Shock and Three Scenarios for 2027
5. The Global South Double Shock and Three Scenarios for 2027
5.1 The Double Shock: Higher Oil Bills, Less Climate Finance
The cruelest consequence of the 2026 Iran war is falling on countries that had nothing to do with starting it.
Consider the situation of a typical oil-importing developing country — say, Bangladesh, Sri Lanka, or a sub-Saharan African state. Before the war, they were already dealing with: the climate finance architecture failing to deliver on its promises (Volume 3); the green transition creating new extractive pressures on their mineral resources without giving them the industrial benefit (Volume 4); and the NATO-driven critical minerals competition making their negotiating position harder (Volume 5).
Now add the Iran war. Their fuel import bill just jumped 30-50%. Their food costs surged because fertiliser prices collapsed. The dollar is stronger so their foreign debt is more expensive. The climate finance they were promised is being quietly deprioritised as G7 governments deal with their own energy crises.
The World Bank projects developing economy inflation averaging 5.1% in 2026 — a full percentage point above pre-war projections. Growth in developing economies is falling by 0.4 percentage points. Over 70% of commodity-importing developing countries are growing more slowly than projected before the war. This is not an economic statistic — it represents real cuts to real government budgets, including the climate adaptation spending that vulnerable communities depend on.
And the supply side of climate finance is contracting at the same moment. Germany is suspending fuel levies. The UK is cutting fuel duty. France is reducing electricity taxes. The US administration is suspending climate-related foreign assistance. All of this is fiscally understandable under the circumstances. But it all means less money available for the NCQG's $300 billion target that was already in trouble before the war started.
For Global South climate negotiators arriving at COP31, this is the fundamental indictment: the same governments that committed to climate finance when it was convenient are walking it back when it becomes expensive. The credibility of the entire climate finance architecture is on trial in Antalya.
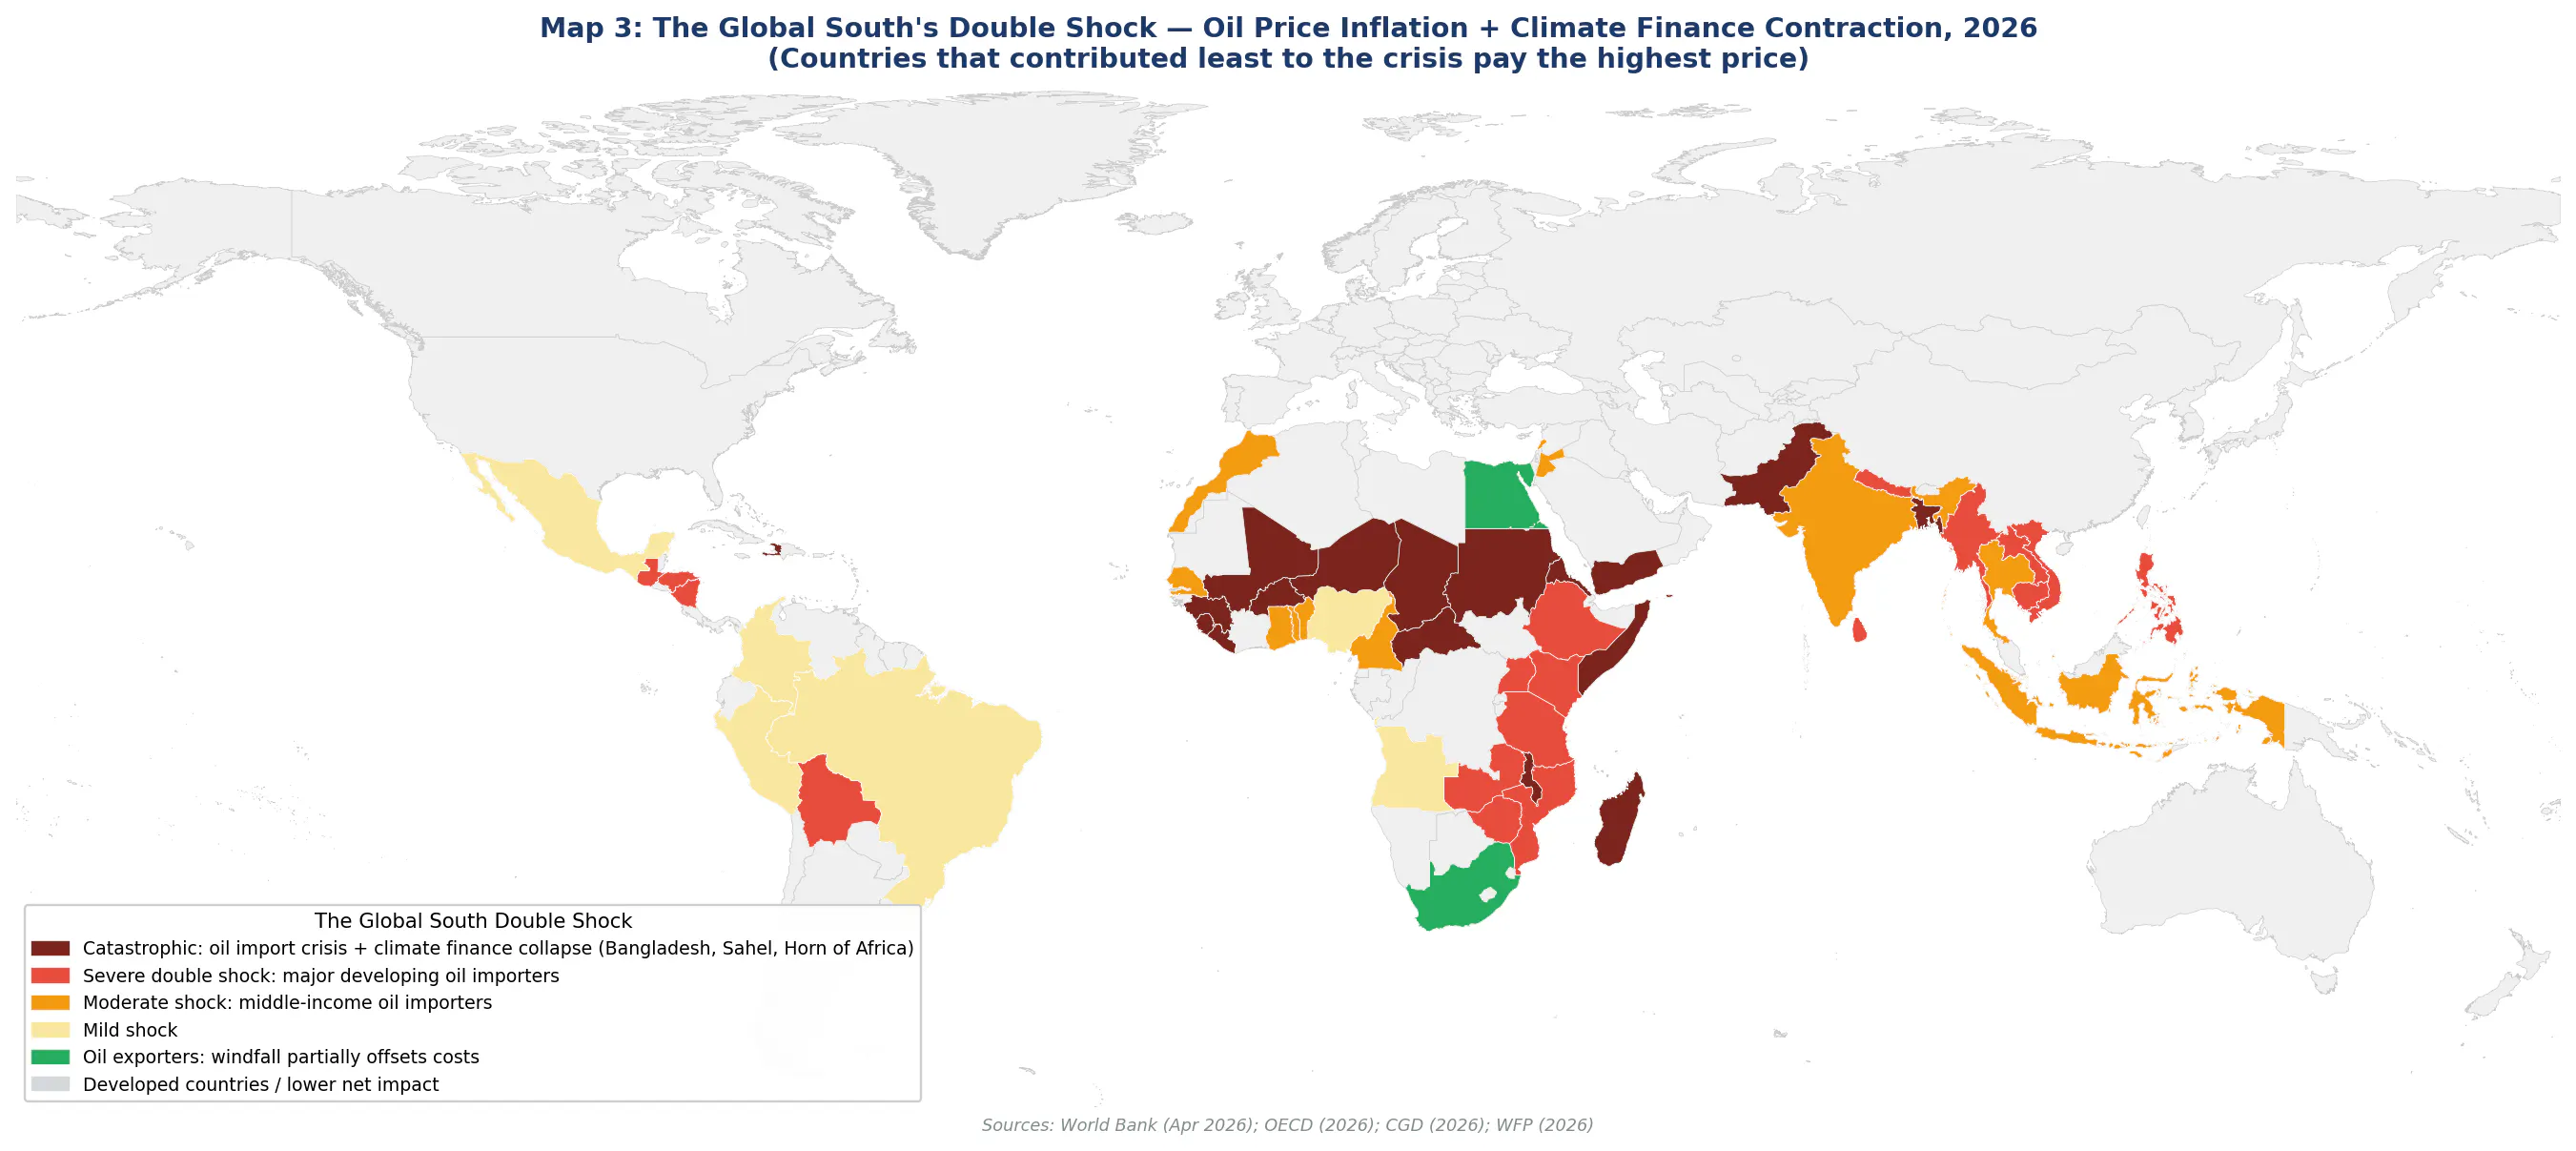
Map 3: The Global South's Double Shock — Oil Price Inflation + Climate Finance Contraction, 2026. Countries that contributed least to the crisis pay the highest price. Sources: World Bank (Apr 2026); OECD (2026); CGD (2026); WFP (2026)
5.2 Three Countries at the Intersection
Bangladesh is facing what analysts are calling 'recession-like conditions.' It imports 80% of its petroleum. It is one of the most climate-vulnerable countries on earth — sea level rise, cyclone intensification, flooding threaten its agricultural system and its coastal cities. Before the war, it was making serious progress on solar deployment, targeting 40% renewable electricity by 2030. The Iran war has simultaneously increased its fossil fuel import bill, reduced the foreign exchange available for renewable equipment, and diverted government attention from climate adaptation to immediate energy crisis management. Bangladesh is experiencing the paradox of the 2026 shock most sharply: the country that most needs the energy transition is least able to afford it right now.
Egypt is a more complicated case. It exports natural gas — though production is declining. It operates the Suez Canal, which is capturing increased transit revenue as ships reroute around Hormuz. It is the world's largest wheat importer, so food price inflation hits it hard. Its government is managing multiple contradictions simultaneously: collecting additional canal revenues, seeing higher domestic energy costs, and managing political pressure from food inflation. Egypt's position illustrates that 'winner' and 'loser' are not the right categories — most countries are simultaneously both, in different sectors and at different timescales.
South Africa holds 91% of the world's platinum — essential for hydrogen fuel cells and the hydrogen economy that has gained urgency from the oil shock. In theory, this is a transformational opportunity: South African platinum powers a domestic green hydrogen industry that reduces dependence on oil imports while exporting clean energy to Europe. In practice, the immediate response to the energy crisis has included extending coal plant lives and delaying renewable procurement. South Africa is both best-positioned to benefit from the long-term transition and most tempted to regress in the short term — a microcosm of the global dilemma.
5.3 Three Scenarios for 2026-2027
What happens next depends on three things: whether the ceasefire holds, how fast Gulf energy infrastructure is repaired, and what decisions are made at and around COP31. Three scenarios capture the range of possibilities.
Scenario 1: Supercharging (The Best Case). The ceasefire holds. The Strait is fully open by August. Brent settles around $80-85 for the rest of the year. The brief period of $120 oil has been enough to trigger lasting policy changes. The EU's electricity tax reform passes. Record renewable deployment makes 2026 a turning point year. COP31 produces a round of enhanced NDCs that lock in the energy security-driven transition impulse. In retrospect, the Iran war accelerated the green transition by 3-5 years. Even the Global South benefit, as the political momentum for clean energy creates new financing pathways and reduces technology costs faster than projected.
Scenario 2: Prolonged Disruption (The Bad Case). The ceasefire breaks down in July or August. Brent climbs back toward $110. Western governments face a second wave of fiscal pressure. Coal consumption extends into 2027. COP31 produces minimal new commitments — a fractious debate between a Global South demanding emergency climate finance and developed countries citing fiscal constraints. The climate setback is measured not in years of delay but in locked-in emissions from extended fossil fuel use and delayed transition investment. The NCQG framework is effectively suspended.
Scenario 3: Structural Bifurcation (The Most Likely Outcome). The ceasefire broadly holds but the Strait remains insecure through 2026, keeping oil around $90-100. This scenario is already visible in microcosm in Turkey's position as COP31 host: simultaneously a NATO member accelerating renewable deployment under energy security pressure, a Russian nuclear energy client under the Akkuyu BOO contract, a Gulf LNG importer managing deferred payment arrangements through BOTAŞ, and a transit hub caught between competing energy geopolitical blocs — Turkey's dual energy exposure, analysed in section 3.1, is a compressed version of the bifurcation dynamic playing out globally. The Global North — with fiscal capacity and strong energy security incentives — accelerates its renewable transition, hitting record clean energy investment. The Global South gets a mixed result: oil exporters (Brazil, Nigeria, Angola) capture windfall revenues that create investment opportunities; oil importers (Bangladesh, Pakistan, East Africa) face a 2-3 year climate transition delay. The result is a deepening divide between the renewable trajectories of wealthy and developing countries — the structural inequality this series has documented since Volume 1, now made concrete by a geopolitical shock. This is not a scenario. It is already happening.
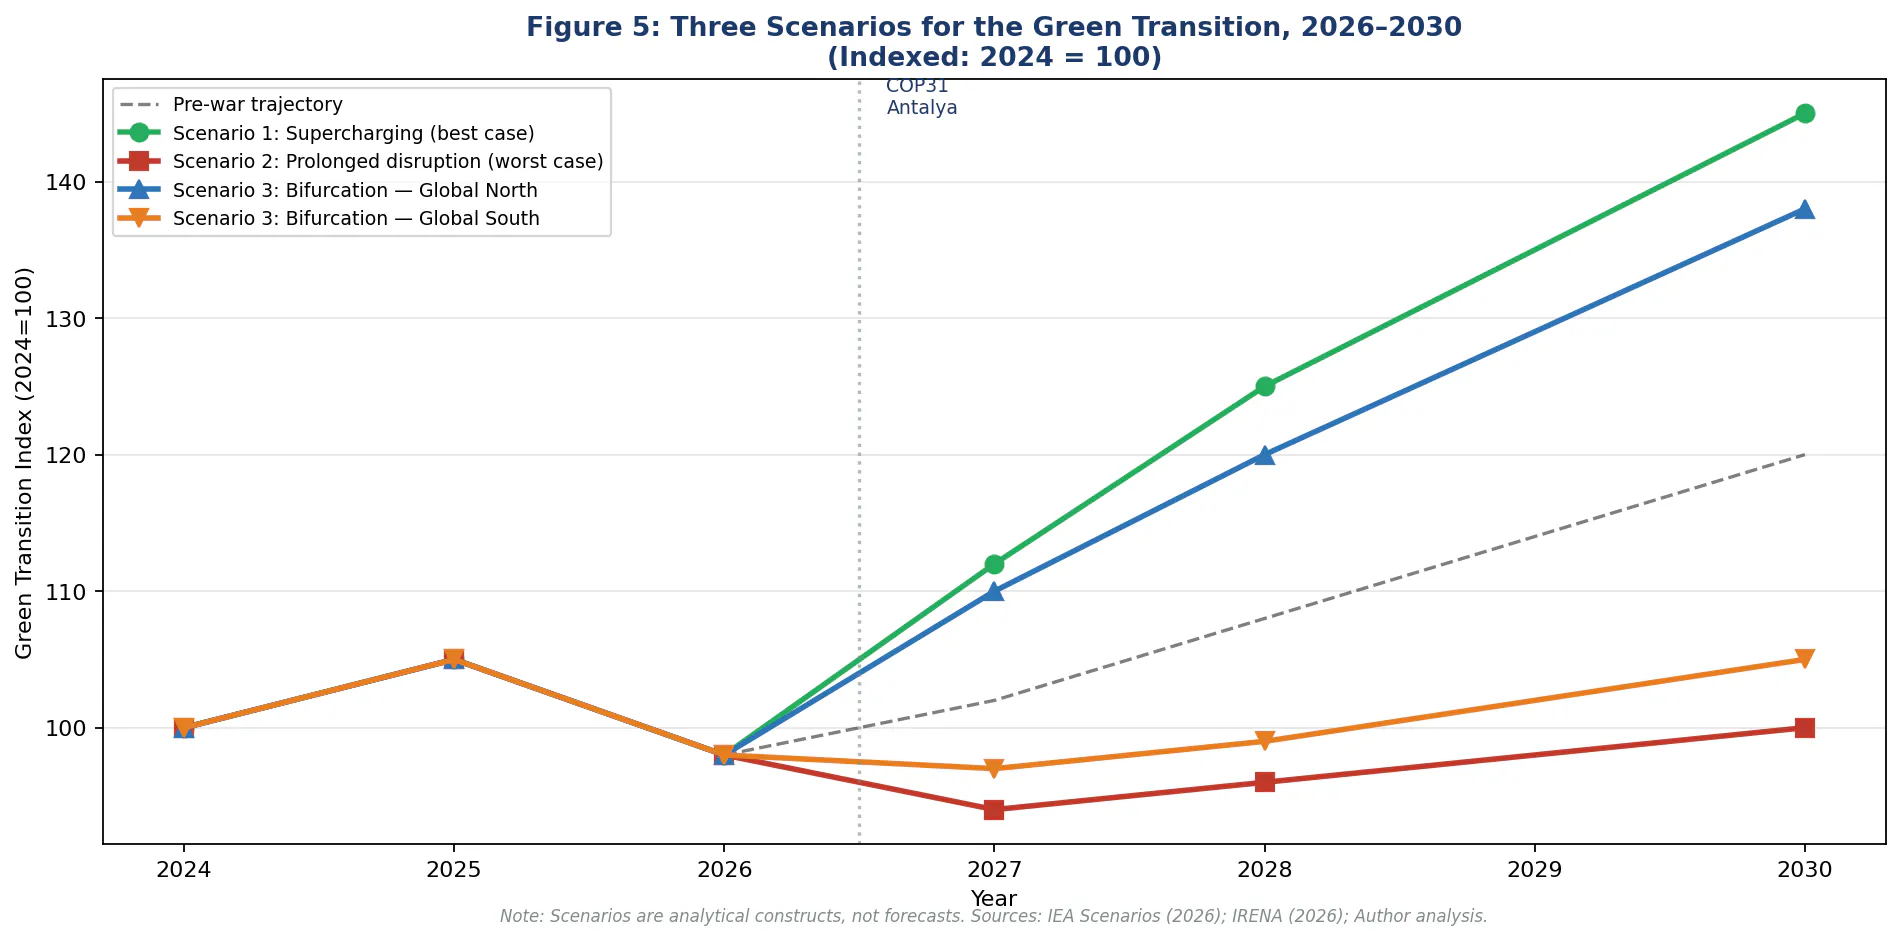
Figure 5: Three Scenarios for the Green Transition, 2026–2030. Scenario 3 (bifurcation) is already happening — the Global North accelerates while the Global South falls behind. Sources: IEA Scenarios (2026); IRENA (2026)
6. Conclusions: The Thread That Connects Six Volumes
The 2026 Iran war has confirmed what this series has argued across six volumes: climate change and geopolitical instability are not separate problems. They are the same problem, seen from different angles.
The war happened partly because of fossil fuel politics — decades of Middle East instability rooted in oil wealth and its misgovernance. It is reshaping climate politics in real time — simultaneously accelerating the transition that would reduce future fossil fuel dependence and creating the economic conditions that make that transition harder to afford right now.
The six volumes of this series traced a single thread from beginning to end. Volume 1: climate change multiplies instability in the world's most fragile regions. Volume 2: the Arctic is being transformed, opening new strategic competition. Volume 3: the climate finance system is failing the people most in need. Volume 4: the green transition is reproducing colonial resource extraction under a new banner. Volume 5: even NATO is struggling to integrate climate into its security planning. And now Volume 6: a war — rooted in the geopolitics of fossil fuel power — is simultaneously the best argument for the green transition and the biggest single threat to its near-term implementation.
The thread connecting all six: the world is not failing to address climate change because the problem is too hard or the solutions too expensive. It is failing because the systems that govern energy, finance, security, and trade were built for a different era — and they are producing the same injustices, the same power asymmetries, and the same short-term thinking that created the climate crisis in the first place.
The Iran war will end. The Strait will reopen. Oil prices will normalise. But the structural challenge does not go away with the ceasefire. The question — the one this series has been asking from page one — is whether the people and institutions with the power to change those systems will use it.
So far, the answer has been: not enough, not fast enough, and not equitably enough. That can change. But it will require choosing the future over the present, and the many over the few. That is not an economic problem. It is a political one.
The Complete Series: Geopolitics & Climate Change
No. 1: The Climate Multiplier — Sahel, Middle East, South Asia. Climate as a force that multiplies existing instabilities.
No. 2: The Arctic — The New Great Game. Ice melt opening new strategic competition.
No. 3: Climate Finance and the Global South Revolt. The broken promise of $100bn, the NCQG illusion, and structural power asymmetries.
No. 4: The Green Transition as New Colonialism? Critical minerals, value chains, and extractive logic under a green banner.
No. 5: Climate Security and the NATO Green Turn. How climate change is reshaping alliance security, Arctic strategy, and defence supply chains.
No. 6 (this volume): The 2026 Iran War and Its Climate Policy Consequences. The crisis that proved every previous volume right.
References and Key Sources
Official Sources and Data
IEA (2026). Global Energy Crisis Monitor — Iran War Edition. March-June 2026.
World Bank (2026). Commodity Markets Outlook — April 2026. Washington DC.
UNFCCC (2026). COP31 Antalya Preparatory Documents. June 2026.
IEA (2026). Birol: This is the Biggest Energy Crisis in History. Press Statement, March 2026.
WFP (2026). 45 Million at Risk of Acute Food Insecurity — Iran War Impact Assessment. April 2026.
IRENA (2026). Global Renewable Energy Capacity Data — Q1 2026. May 2026.
Research and Analysis
CGD (2026). The Iran War's Economic Impact on Developing Countries. Center for Global Development, May 2026.
Commodity Context (2026). Rory Johnston analysis — oil market scenarios. March-May 2026.
SETA Foundation (2026). Carbon Cost of the 2026 Iran Conflict — First Assessment. April 2026.
Bloomberg NEF (2026). Energy Transition Research — Iran War Edition. April 2026.
Bloomberg Intelligence (2026). Oil Markets Monitor — Geopolitical Risk Premium Analysis. 2026.
ORF (2026). Iran War Climate Consequences — Strategic Analysis. May 2026.
Euronews / Reuters / AP (2026). Continuous coverage, February-June 2026.