


I had a number. A number telling me that the entire American AI buildout added 82 megawatts of round-the-clock load last quarter. Eighty-two. For the whole country. I pondered over it for a few hours, having a blast, only for me to work out that it was all garbage.
The industry prices this off the announcements. The announced gigawatts, which cost nothing. I wanted to plumb something that the press cannot disclose. You see, a datacenter, it is a shape more than a quantified number; it stays flat through the night at 90% of nameplate, where ordinary demand drops off at four in the morning. If it is real, the overnight trough climbs faster than the afternoon peak.
So EIA publishes hourly demand for every balancing authority back to 2019. It is free, no key, 26 megabytes per file. April through June across three years, shoulder months, so weather noise is the smallest. Average daily trough, average daily peak, load factor, every system.
National load factor: 86.97% down to 86.72%. The peak accelerated faster than the trough. The grid got PEAKIER. Net excess trough across 43 balancing authorities: 82 megawatts.
Then I remembered PJM is 107 GW, and Northern Virginia is one zone inside it.
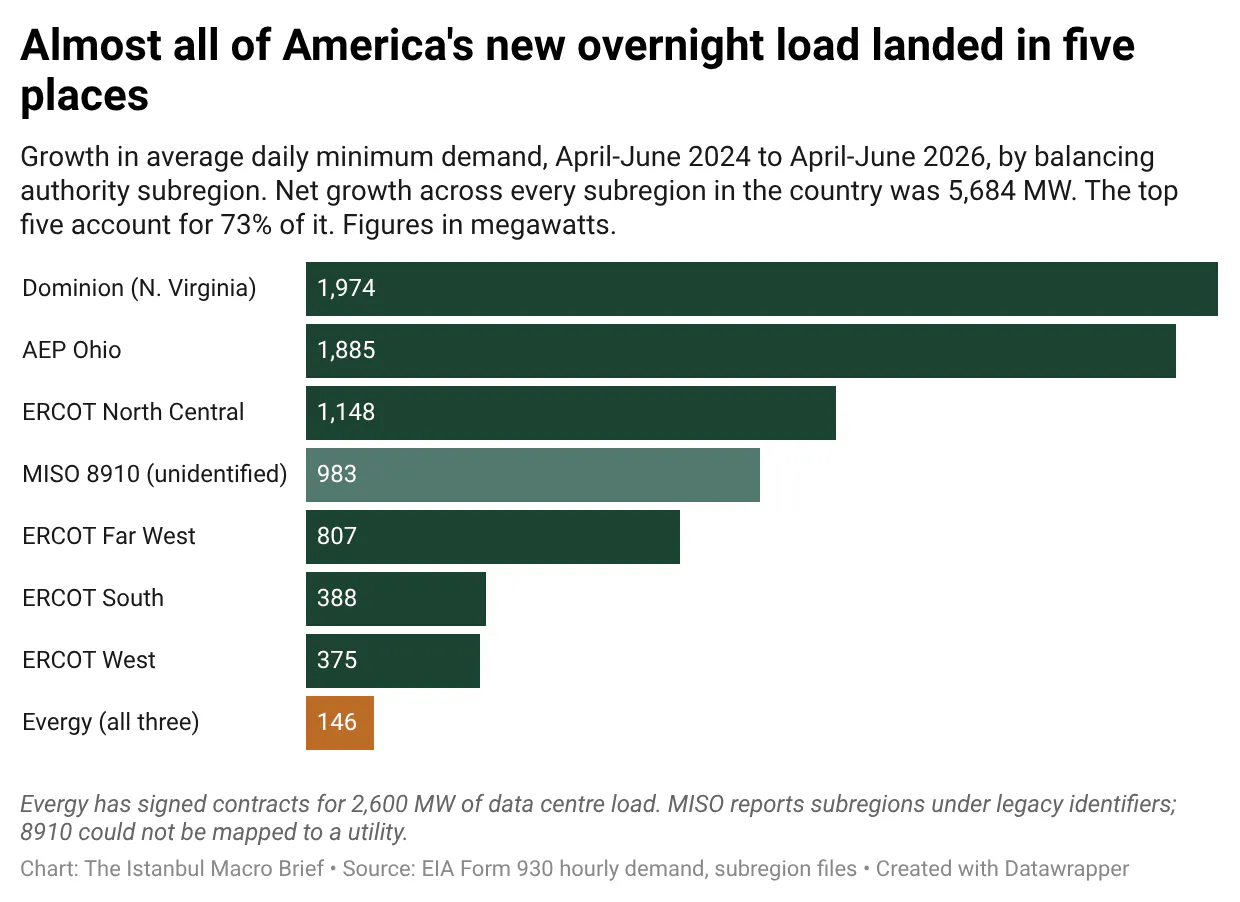
The subregion files. Dominion: trough 11,215, then 12,199, then 13,189. That right there is up 1,974 megawatts in two years, with load factor going from 85.39 to 86.68. Ironically, this has always been there. It was just buried under nineteen other PJM zones going the other way. If we take Dominion out, the rest of PJM runs from 86.34 down to 85.77.
AEP Ohio: 11,913 to 12,526 to 13,798. Up 1,885 megawatts; load factor 87.39 to 89.50. Ohio is flattening faster than Data Center Alley and is within a hundred megawatts of it in absolute terms. I spent a good enough time trying to find anyone writing anything about this. No luck.
Net trough growth across every subregion in the country is 5,684 megawatts. The top five account for 4,154 of it. 73% in five different places.
Time for the filings; I can't make an assumption unless I know how much of what is signed is actually contracted.
Every 10-Q since mid-July, searched for "signed electric service agreements." No mention of pipeline or queue. Signed. There are two companies in the market that use it. Search the phrase Evergy uses for money: "remaining contractual minimum consideration," and you get one filer. Fifteen utilities mention remaining performance obligations alongside large loads, and when you assess them, Sempra's are transmission capacity and gas storage; Duke's are wholesale energy blocks. None of it is data center load.
Evergy. 2,600 megawatts signed. Revenue note: customers above 75 megawatts have agreements requiring a minimum amount of consideration through the end of a term longer than a year. Remaining performance obligations: 8.9 billion dollars, weighted average of 15 years, minimum at 80% of expected annual capacity demand, excluding fuel, held at today's rate with no allowance for 15 years of rate cases. In words, this is a floor under a floor under a floor.
That disclosure is not in the February annual report. It appears for the first time on the 7th of May at 8.7 billion. Remember, not existing to 8.7 billion in a single quarter.
Ameren filed three days earlier. 2.8 gigawatts executed, slightly more megawatts. Their note says remaining performance obligations over a year were "immaterial." I checked the prior quarter as well. Immaterial at 31 March, the same date Evergy printed 8.7 billion.
The straightforward, obvious answer is that Ameren's haven't started, whilst Evergy's have. That gets dismissed in Evergy's own footnote, which says the remaining contractual term begins with the start of the service. Evergy is booking 8.9 billion on contracts that haven't started either.
The other answer is that the contracts differ. Kansas approved Evergy's tariff on 6 November 2025. Missouri approved Ameren's on the 24th. Eighteen days apart. Ameren's own investor deck from the day of the order: twelve-year term after ramp, minimum demand charge of 80% of contracted capacity, exit fees, collateral of two years of minimum monthly bills. Evergy's: five-year ramp, then twelve, minimum monthly bills on requested capacity, collateral, exit fees. The same threshold and 80%.
There is no clear explanation for this.
What I do know is that Ameren filed in July to build the West Alton gas plant at 2,100 megawatts. 2,100 megawatts of gas against 2.8 gigawatts of contracts they call immaterial.
Evergy's three utilities report separately in the grid data as Westar, KCP&L, and Greater Missouri Operations. I literally only found that by pulling a crosswalk table as raw Parquet and reading the strings out of the binary.
Combined trough: 5,066 in 2024, 5,141 in 2025, 5,212 in 2026. Up 146 megawatts against 2,600 contracted.
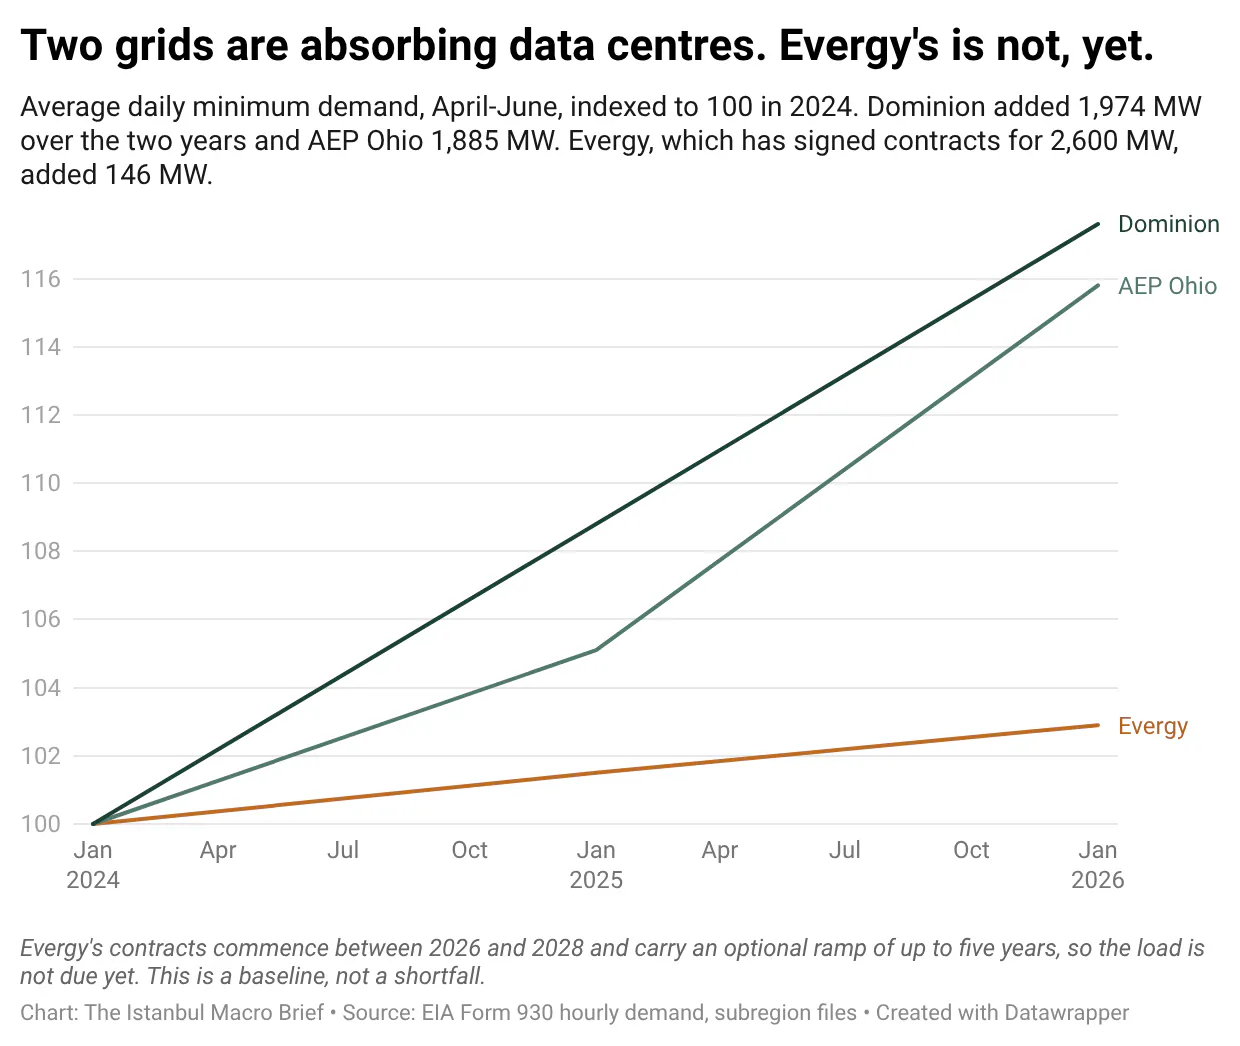
Right before anyone runs with that, Evergy has not missed anything. Service commences from 2026 to 2028, and the agreements carry an optional ramp of up to 5 years. The load is NOT due yet. Load factor climbed from 82.91 to 84.20, so the signature is there, a little early, though. I don't want to write this as a failure; it would just be lazy. The first person who covers utilities properly would take me apart for it.
So it's a baseline. Today it is 146. Next quarter it may or may not move.
Ameren's tariff requires collateral of two years of minimum monthly bills, and their cash flow shows 43 million received. On Evergy's own economics, full collateral of 2.8 gigawatts is roughly 1.28 billion. Evergy's unbilled receivables sit at 244.6 million against 248.0 a year prior. MISO could not be cracked. They report subregions under legacy balancing authority numbers, and 8910 is the third-biggest trough gain in the country at 983 megawatts. ERCOT and Southwest Power Pool names came out of the crosswalk fine. MISO would not decompress. If 8910 sits in Ameren's territory, some of the above needs rewriting.
My 4 calls would need resolving on the Q3 filings in early November.
Evergy's remaining performance obligations print above 8.9 billion as of 30 September.
Ameren's large load collateral prints above 43 million. That is the cash test, where I have the highest probability of being wrong, because collateral timing is lumpy.
Ameren writes "immaterial" again in Q3.
Evergy's combined trough prints above 5,212 when EIA publishes the back half of 2026.
Kansas, Missouri, Oklahoma and Texas have all landed on 75 megawatts and an eighty percent minimum within twelve months, none coordinating. The four commissions decided independently that the distance between a signature and connection is worth charging for.
It might be true that my trough method is picking up something else entirely. There is no clean way from outside to pull weather apart from load.
fin